
Abstract
Studies show that the average person asks about 20 questions per day! Of course, some of these questions can be simple, like asking your teacher if you can use the bathroom, but some can be more complex and challenging to find an answer. That is where statistics comes in handy! Statistics allows us to draw conclusions from a set of data and is often called the “Science of Data.” It can also help people in every industry answer their research or business questions, and can help predict outcomes, such as what show you might want to watch next on your favorite video app. For social scientists like psychologists, statistics is a tool that helps us analyze data and answer our research questions.
Asking Research Questions
Scientists ask a variety of questions that can be answered with statistics. For example, a research psychologist might be interested in how test performance is affected by the amount of sleep a student gets the night before the test. Psychologists, biologists, and many other types of scientists are interested in answering questions about a population, or a group of individuals. For example, a biologist might be interested in studying a specific type of bird as a research population, a developmental psychologist might be interested in researching children ages 3–6 years old, or a clinical scientist might be interested in patients with a certain type of disease. The type of statistical analysis that should be conducted depends on the question asked and which variables are being measured. Variables are factors, traits, or conditions that can exist in different amounts or types, like height, age, or temperature.
Sampling From a Population
When answering our research questions, often it is not possible to collect information from everyone in the population we are interested in. For example, when seeing if sleep affects test performance, we cannot possibly collect sleep information and test scores from every student in the world! That is why we collect data from a sample of individuals that best represents the population. It is important that the characteristics of our sample are similar to the characteristics of the whole population. Social scientists make sure their samples have similar age or ethnic groups that are typical of the whole population. If we do not make sure that our samples have the same sort of characteristics that the overall population has, there could be problems answering our research questions Figure 1.
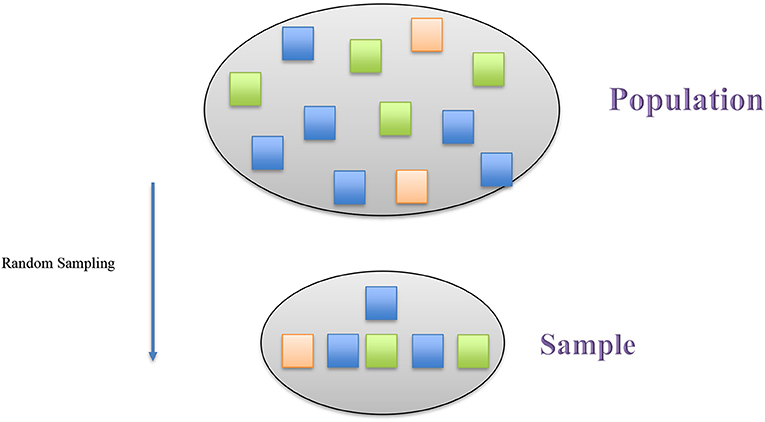
- Figure 1 - Random sampling is a way that a sample can be chosen so that it accurately represents the population.
- In random sampling, every individual in the population has an equal chance of being selected for the sample. In this example, each color within the population is also present in the sample, and the proportions of each color are represented in the sample, as well.
For example, let us say a veterinarian is interested in calculating the average weight of all dogs. She collects a sample of five dogs to weigh, finds the average weight of her sample and concludes that the average weight of all dogs is between 10 and 15 pounds. If you are a dog lover, you might suspect that something does not seem right with this number. Some dogs are rather large, so you may expect the average to be higher. What if the veterinarian collected a sample only of Chihuahuas? In that case, we certainly cannot say that all dogs weigh between 10 and 15 pounds; the sample contained only one breed and was not representative of all types of dogs. If the veterinarian had a sample that better represented the population of all dogs, the average weight she measured from the sample would likely be very different.
A key method of selecting individuals to be in a sample to best represent a population is called random sampling. Scientists use random sampling to guarantee that every individual in the population has an equal probability of being selected, and this ensures that the sample is most similar to the overall population.
Estimating From a Sample
Once the scientist gathers the sample, he or she might want to make conclusions about that sample and generalize the findings to the broader population. For example, a scientist might want to know the average number of hours of sleep 12-years old children get each night, or the average height of high schoolers in the US. In order to estimate the value of a variable in a population (like average height), scientists calculate a point estimate from the sample. A point estimate is a number that estimates the true value of a variable in a population, and often the point estimate is an average. For example, if we want to find out the average number of children per household in the city of Chicago, we would gather a random sample of families in Chicago and ask each family how many kids live in their house. Then, using this information, we could calculate the average number of children from these houses to calculate our point estimate. We can then assume that the average number of children in our sample is very similar to the average number of children in all Chicago households (Figure 2).
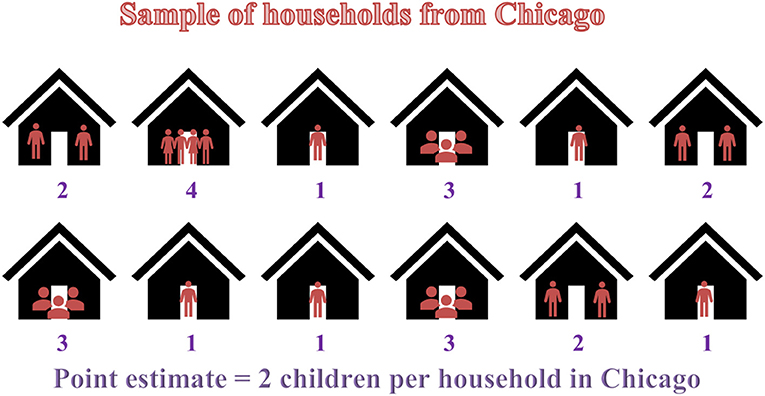
- Figure 2 - Rather than going to every house in Chicago to figure out the average number of children per home, scientists can take a sample.
- Here, the number of children from each household in the sample was collected and the sample mean was calculated. The scientist found that Chicago has an average of two children per household, which is called the point estimate.
Measurements and sampling methods can never be exact, so scientists often use confidence intervals around point estimates, to show a range of values that likely contain the true average of a variable in the population. In order to calculate the confidence interval, the scientist must first calculate the margin of error. The margin of error is a calculated amount that is added to and subtracted from a point estimate. It is a way of numerically representing miscalculations or errors in sampling from the population (such as when a sample is not totally representative of the population).
Let us practice calculating a confidence interval! Imagine we collect a sample of 49 students for a sleep study, and we find the average amount of sleep for the students is 10.5 h (our point estimate). Next, we need to figure out the standard deviation, which is the average distance between each person's data point and the total average. When the standard deviation is small, that means most data are close in value to the average, and a large standard deviation means the data are more spread out over more values. In our sample, let us say the standard deviation is 1.5 h. We then need to calculate the margin of error using this formula:
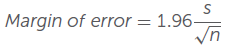
In this formula, s represents the standard deviation (1.5 h) and n refers to the number of data points in our sample (49 people). We replace the symbols with their corresponding values and calculate our margin of error to be 0.42 h of sleep. To complete the confidence intervals, we add and subtract the margin of error from our point estimate, to get the lower and upper bounds of the confidence interval. Psychologists typically use a 95% confidence interval to calculate the margin of error, which means that we can be confident that, 95% of the time, our confidence interval contains the actual population average. Our confidence interval for the point estimate in our example would be 10.5 ± 0.42 h, or 10.08 and 10.92. This means that, 95% of the time, the number of hours of sleep students in the overall population get is between 10.08 and 10.92 h (Figure 3).
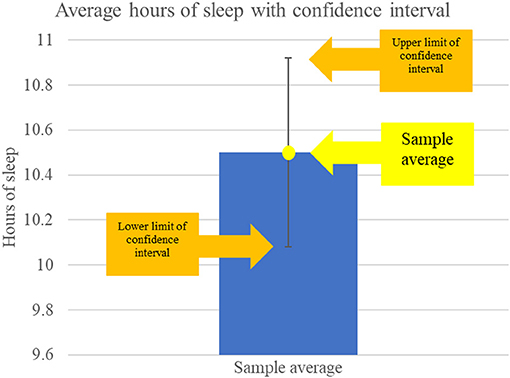
- Figure 3 - Confidence intervals show us a range of values that likely contain the true population value of a variable.
- This example shows the average hours of sleep in our sample (10.5 h). The bar shows the 95% confidence interval around the average, with 0.42 h of sleep added to and subtracted from the average to give the margin of error. The confidence interval shows that the true average hours of sleep students in the overall population get is somewhere between 10.08 and 10.92 h of sleep.
Scientists can reduce the margin of error in several ways to make their estimate of the population more precise. One way is to get more individuals in the sample, so that the sample is more representative of the population. Another way to reduce the margin of error is to make sure data collection is as error-free as possible to reduce variability in data, such as making sure all measurement tools (like scales, surveys, rulers, etc.) are accurate in what they are measuring. The more accurately the sample represents the population, by using random sampling and good data-collection practices, the smaller the margin of error and the more precise the confidence interval will be for estimating the true population value.
Asking More Complex Research Questions
Sometimes scientists want to go beyond describing simple calculations like average heights or age in their populations, to understanding aspects of their populations that are more complex. Let us say we are not only interested in seeing how much sleep students get, but we want to know how much test scores will drop after losing a few hours of sleep. Effect sizes are values that estimate the magnitude of a phenomenon, or the degree to which one variable (like hours of sleep) impacts another variable (like test scores). For example, if getting only 3 h of sleep lowers your test grade by a few points compared with when you get 9 h of sleep, you might not “lose sleep” about losing sleep. While there is a difference in the score, that is not a large difference. However, if after losing 6 h of sleep, you drop many points on a test, that could have a major impact on your grade. In this case, you would likely agree that the effect of losing sleep on your grades is an important one.
There are different ways to calculate effect size, depending on the research question and which type of statistics a scientist uses. Once a scientist calculates an effect size, he can determine if the effect is small, medium, or large. Effect sizes allow the scientist, as well as other people reviewing the findings, to better understand the effects certain variables have on other variables in the population.
Conclusions
Scientists ask many different types of questions, and there are many ways statistics can answer those questions. The examples of statistics we discussed in this article are ways that social scientists can answer simple questions from samples. But, statistics is not limited to any field or area of scientific research. Statistics has helped scientists know if medicines are likely to cure diseases, and has helped engineers understand the safety of the vehicle you ride in. It does not stop there; there are endless questions we can answer with statistics.
Glossary
Population: ↑ An identified group of individuals that scientists want to answer questions about.
Variable: ↑ A factor, trait, or condition that exists in different amounts or types that is measured in research.
Random Sampling: ↑ A way of selecting individuals from a population that ensures that every individual has an equal probability of being selected.
Point Estimate: ↑ An estimate of some value in a population, such as an average.
Confidence Intervals: ↑ A range of values around point estimates that likely contain the true value of a variable in the population.
Margin of Error: ↑ A calculated amount added and subtracted to a point estimate, which is taken into account for miscalculation or errors.
Standard Deviation: ↑ The average distance between each data point and the total average.
Effect Size: ↑ Tells us how much difference there is between averages of variables.
Conflict of Interest Statement
The authors declare that the research was conducted in the absence of any commercial or financial relationships that could be construed as a potential conflict of interest.
Further Reading
Cumming, G. 2013. Understanding the New Statistics: Effect Sizes, Confidence Intervals, and Meta-Analysis. New York, NY: Routledge.