
Abstract
Some people say mathematics is the most important subject in science because it is the language of nature. In this article, we provide examples for this by explaining causality. Causality is an important concept because it influences essentially all areas of science and society. In simple terms, causality is the principle that examines the link between a “cause” and an “effect”. This allows us to study important practical questions. For instance, in medicine, biology or law, one can ask “What medication can be used to treat this disease?” “What protein activates a certain gene?” or “What criminal act caused the harm?” To answer these and similar questions, methods from probability, statistics, and graph theory are needed to quantify the meaning of causality. In this article, we provide an overview of this fascinating topic.
What is Causality?
The study of causality has a long lasting history dating back to the philosophers Aristotle (384–322 BC) and David Hume (1711–1776). While their work is important addressing philosophical questions about causation like “what it means for something to be a cause”, for the quantification of causality allowing a form of measurement, mathematical models are needed. Such causal models go back to Sewall Wright (1889–1988) Donald Rubin (1943-) and Judea Pearl (1936-).
Causality refers to the relationship between a “cause” and an “effect”, where the effect is a result of the cause. It is the principle that helps us understand how things are related and how they change. Simply put, causality is the study of how things are related and how they change. It is the link between an event and the outcome of that event.
For example, imagine you are playing with a toy car, and you push it across the floor. The cause of the toy car moving is you pushing it. The effect is the toy car moving across the floor. Without the cause (you pushing the car), the effect (the car moving) would not have happened. Another example is when you plant a seed in the ground. The cause is you planting the seed. The effect is the seed growing into a plant. The cause and effect are closely related to each other—without planting the seed (cause), the plant would not grow (effect).
Causality is very important in scientific research, where scientists try to understand how things work by studying causes and effects. For example, a scientist may conduct an experiment to find out how a certain medication affects a person’s health. The medication is the cause and the effect is the change in the person’s health.
Causality requires three parts: a cause, an effect, and a relationship between the two (Figure 1A). Causality can be visualized using a graph (sometimes also called a network) [1]. In the mathematical language of graph theory, a graph consists of two building blocks: nodes and edges. The cause and effect correspond to nodes (circles in Figure 1A) and edges are the links between the nodes. If you want to learn more about graphs or networks in general, please see our previous Frontiers for Young Minds article.
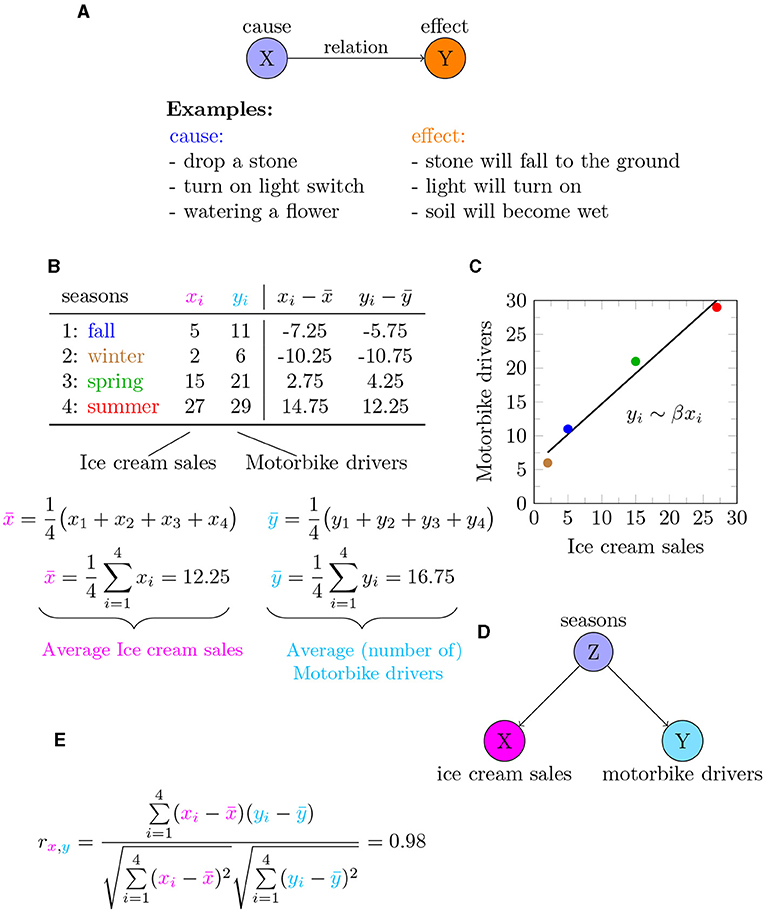
- Figure 1 - Visualizing causality using math.
- (A) The relationship between a cause (X) and an effect (Y). (B) Data for ice cream sales (xi) and motorbike drivers observed on the road (yi) for each season (corresponding to i). (C) Graphing the values in (B) (where the color corresponds to the seasons) indicates that the two observations are correlated. But this does not mean that one causes the other! (D) Alternative relationship, showing that the season of the year influences both ice cream sales and number of motorbike drivers. (E) Correlation value between ice cream sales and motorbike drivers.
Now that you know that causality is useful for describing the relationship between “cause” and “effect,” the next question is to ask: How do we measure causality? Unfortunately, there is no physical measurement device that can be directly used to measure a causal relationship between two things the way a thermometer measures temperature or a barometer measures atmospheric pressure, for example. Instead, a causal relationship can only be “measured” using a combination of mathematical tools from the fields of probability, statistics, and graph theory. We will show you a problem that can happen if we try to use only a statistical approach.
What is the Problem With Statistical Measures?
To demonstrate why it is difficult to measure causality, let us start with a simple example. Assume it is summer and very hot. On the beach you can see many people wearing shorts and eating ice cream. Could you say that wearing shorts makes you eat ice cream? It is probably obvious to you that, even though many people are both wearing shorts and eating ice cream, one factor does not cause the other. There is a statistical measure that allows us to quantify such an association precisely. This association measure is called correlation. Mathematically it is denoted by rxy where x and y indicate that it is evaluated for two variables.
To understand how to estimate correlation from data, let us consider a second example. Suppose for each season of the year, we have information about ice cream sales. We assign “ice cream sales” the variable xi where i denotes a season, i.e., i ϵ {season: fall, winter, spring, summer}. Here “i ϵ” means that i can assume all values in the set given by {fall, winter, spring, summer}. The values of xi are shown in Figure 1B. Suppose we also have information about the number of motorbike drivers seen on the streets per season, and we call “motorbike drivers” yi. The values of xi and yi are visualized in Figure 1C. The colors of the points correspond to the seasons, as shown in Figure 1B. The black line in the graph is called a regression line and shows us that the data points fall in almost a straight line. Using these values and the equation of correlation, shown in Figure 1, we find that the value for the correlation between ice cream sales and motorbike drivers is rxy = 0.98.
A correlation value of rxy = 0.98 is a very high value because the maximal value a correlation can assume is 1. So from this analysis, it looks like ice cream sales and the number of motorbike drivers seen on the road are strongly associated. Based on this observation, one could formulate the following question: Do we see more motorbikes on the streets when we eat more ice cream?
You would probably say the answer to this question is “no”.
This means that, even though the statistical technique gave us a high correlation, that does not ensure that “ice cream sales” is the cause for “lots of motorbikes.” In other words, a high correlation does not ensure that there is a causal relation. If you think carefully, you can come up with an alternative explanation for this situation. Instead of assuming that either “ice cream sales” is a cause of “motorbike drivers” or vice versa, it is more reasonable to think that there is a third variable playing a role—that is, the season of the year. Figure 1D shows “seasons” as the cause and “ice cream sales” and “motorbike drivers” as two effects.
Overall, the two examples we have shown tell you something very important: correlation is not causality.
Why is Causality Important For Science?
Understanding causality allows us to make predictions about what will happen in the future, based on past experience, and helps us to identify the factors that contribute to certain outcomes.
In medicine, causality is used to understand how various factors contribute to an individual’s health. This helps doctors and researchers develop effective treatments and preventative measures.
An example for the use of causality in biology is the identification of gene regulatory networks (GRNs) [2, 3]. A GRN is a network similar to the one shown in Figures 1A, D, meaning it consists of nodes and edges. For a GRN, the nodes correspond to genes and the edges to the interactions between genes. Humans have over 20,000 genes, which means GRNs are considerably larger than the networks shown in Figure 1. Such networks provide important information about the functioning of cells because cellular functions are controlled by gene activity. This means a GRN helps researchers to discover which genes turn on (or off) other genes. This helps researchers understand genes better, and it can also help them understand what causes certain diseases.
In psychology, causality is used to understand how various factors contribute to an individual’s behavior and mental health. For example, researchers study the relationship between a person’s emotions and their behavior, or the relationship between a person’s environment and their behavior. Similarly, in economics, causality is used to understand how various factors impact the economy, to make predictions about how the economy will behave in the future.
In summary, causality is studied because it helps us to understand how things happen, how things change, and how various factors contribute to certain outcomes. This knowledge is important for making predictions, designing experiments, and developing effective interventions and treatments.
Potential Outcomes and The Rubin Causal Model
So, now you know that there is a problem with using correlation as a measure of causality. A solution to this problem is provided by the Rubin causal model (RCM) [4]. To understand the basic idea underlying the RCM, let us consider a hypothetical experiment.
Suppose we have a new medication, and we want to test whether it can treat a disease. You could think of aspirin for treating headache, or cough syrup for treating cough, for example. The RCM defines a causal effect, represented as δ, as the difference between having received the treatment and not having received the treatment:
Here Y1 corresponds to the outcome when having received the treatment, and Y0 corresponds to the outcome when not having received the treatment. You could think of Y1 and Y0 as measures for the severity of the headache or the number of coughs within an hour. The preceding description corresponds to a hypothetical experiment because in the real world an individual cannot both receive the treatment and not receive the treatment at the same time. For this reason, the variables Y1 and Y0 are called potential outcomes because both variables could be potentially observed but only one is actually observed.
The good news is that there are some (statistical) tricks that can be used to estimate such a causal effect. The underlying idea of this method is quite simple and based on assigning patients randomly to two groups—one group that receives a treatment and a second group that does not. Assuming patients in both groups are similar, one can estimate a causal effect for the groups. Of course, in the real world, all patients are not identical to each other. For this reason, researchers try to find patients that are similar to each other, with respect to age and general health, for example.
You might have noticed that there is a difference between the causal effect defined for Equation 1 and the description given here. The difference is that the causal effect in Equation 1 is for an individual patient, whereas the causal effect from a randomization is for a group of patients. In statistics, this means we estimate a causal effect for a population of patients. In summary, the randomization of patients allows us to estimate a causal effect between two groups of patients, making the assumption that all patients are similar to each other. This approach is the underling concept of randomized controlled trials (RCT), which are routinely used for approving new medications or treatments.
Conclusion
We hope that our brief overview showed that causality is a fundamental concept that allows us to tackle the most interesting and important problems in society and science. However, measuring causality requires a combined approach, using mathematical methods from probability, statistics, and graph theory and this field is nowadays called data science.
Last, we want to emphasize an aspect of this article that relates to the mathematical language itself. As you can see above, there are various complicated-looking symbols and relations. However, remember that it is completely normal not to understand everything immediately. This is not only the case for pupils in high school, but also for data scientists and statisticians working at universities. In fact, it is very common to study a problem for years before a solution is found. So, do not be intimidated when encountering obstacles—view them as a motivation to work hard to find solutions, even if it takes years. In fact, this is fearlessness that is required for becoming a data scientist. We hope this article helps you realize your potential.
Glossary
Causation: ↑ The relationship between cause and effect, where one event (the cause) brings about or influences another event (the effect).
Graph Theory: ↑ A subject in mathematics that studies structural relationships between variables.
Probability: ↑ A subject in mathematics that describes how likely it is for an outcome to occur.
Statistics: ↑ A subject in mathematics that deals with estimating entities from data.
Regression Line: ↑ A straight line that shows the average relationship or trend between two sets of data points.
Conflict of Interest
The authors declare that the research was conducted in the absence of any commercial or financial relationships that could be construed as a potential conflict of interest.
References
[1] ↑ Pearl, J. 2000. Causality: Models, Reasoning, and Inference. Cambridge; New York, NY: Cambridge..
[2] ↑ Altay, G., and Emmert-Streib, F. 2010. Inferring the conservative causal core of gene regulatory networks. BMC Syst. Biol. 4:132. doi: 10.1186/1752-0509-4-132
[3] ↑ de Matos Simoes, R., and Emmert-Streib, F. 2012. Bagging statistical network inference from large-scale gene expression data. PLoS ONE 7:e33624. doi: 10.1371/journal.pone.0033624
[4] ↑ Rubin, D. 1974. Estimating causal effects of treatments in randomized and nonrandomized studies. J. Educ. Psychol. 66:688–701. doi: 10.1037/h0037350