
Abstract
The Himalayan mountain range is known for its majestic beauty and towering heights, but the very features that make it famous can keep scientists from understanding its details. To make sense of the history of this mountain range, geologists need to see the rocks that they are made of. However, this can be difficult because of the sheer heights and inaccessibility of parts of the range. To solve this, we got a bird’s eye view of these mountains—from space! Using data from the ASTER instrument aboard NASA’s Terra satellite, we looked at the spectral signature of the rocks that make up the mountains. A spectral signature is almost like a fingerprint. We used this information to make a geologic map of the northwestern Himalaya, which helped us to piece together part of the history of these mighty mountains.
Earth’s Story Written in Rocks
A geologic map shows the locations of rocks at Earth’s surface. These maps are like puzzles. Each different rock is an exciting clue about the region’s history. Geologists make geologic maps by visiting places and seeing which types of rocks are present. This helps geologists to tell a story about Earth’s past. Reading the rocks tells them things like when mountains formed and when earthquakes happened.
Much of Earth has been mapped in this way. However, some areas are remote, rugged, or difficult for geologists to get to. This makes it hard for them to make geologic maps of these places because they cannot visit the location in person. One of these hard-to-get-to locations is the northwestern Himalaya (Figure 1). This area includes some Earth’s most famous mountains, like the second tallest mountain in the world, K2. It also includes the southwestern part of the Tibetan Plateau. Rocks and other geologic features here hint at how and when the Tibetan Plateau and Himalayan Mountains formed. Although geologists have broadly mapped this area, the high elevation, rugged mountains, and international borders make some parts of the region unreachable. Therefore, detailed maps of the geology of some important areas are not available.
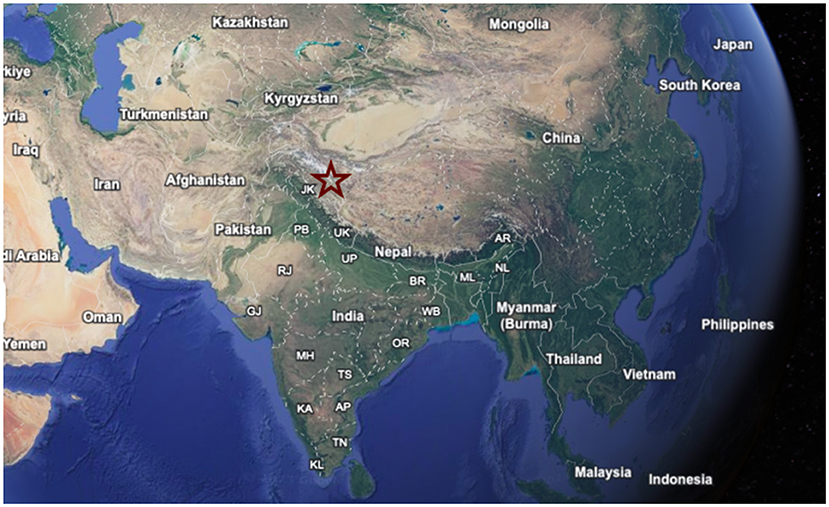
- Figure 1 - This is a Google Map showing the location discussed in this article, marked by a red star.
- It is in an area where the borders of China, India, and Pakistan come together.
Studying The “Fingerprints” of Rocks
When geologists cannot walk directly to rocks, they can instead take to the skies. NASA’s Terra satellite has various instruments that collect many types of data about Earth, including one called Advanced Spaceborne Thermal Emission and Reflection Radiometer, or ASTER, for short [1]. This instrument can provide scientists with information about a type of light humans cannot see, called thermal infrared. When most people hear “thermal infrared”, they imagine cameras that show something that is warm, like maybe a person or an animal. What the camera is really detecting is light with wavelengths that are longer than that of visible light (light humans can see). Thermal infrared light is emitted (released) by all objects. We can figure out what objects are by looking at how much thermal infrared light they emit at various wavelengths within the thermal infrared region of the electromagnetic spectrum. This is called their spectral signature.
Every mineral has a unique spectral signature, which is almost like a fingerprint that helps geologists tell it apart from other minerals. Because rocks are made of different combinations of minerals, looking at all the fingerprints together reveals the rock type [2]. To easily tell types of rocks apart, researchers can show the fingerprints of different rocks using various colors (these are not the same colors that the rocks are in real life). Each type of rock will show up as a unique color. For this part of the Himalaya, we used colors to make a geologic map (Figure 2A) showing the different types of rocks (Figure 2B). We also checked that the fingerprint within each color on our map matched the fingerprint of that same type of rock found in other places in the world (Figure 3).
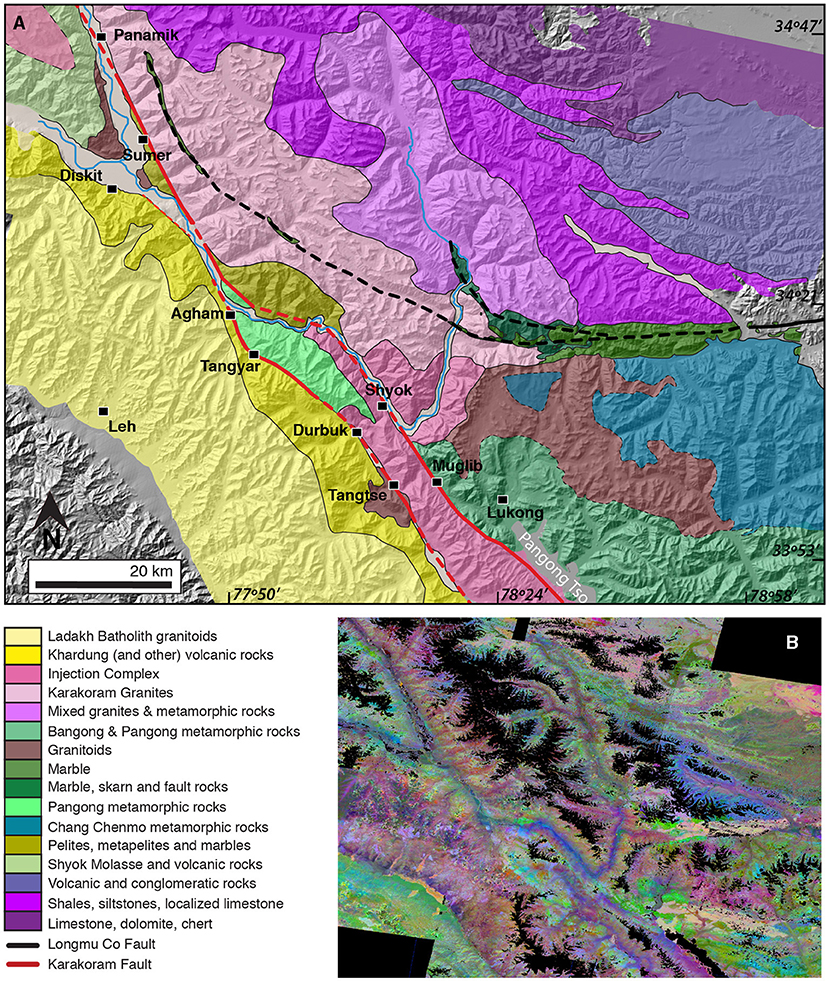
- Figure 2 - (A) An early version of our geologic map.
- (Click here for complete map [3]). Each color shows a different kind of rock (see key). Some of the rocks are named after places. Black squares indicate cities, towns, and villages. Solid lines show the Karakoram and Longmu Co faults where we can see them. Dashed lines indicate where we think the fault might be. (B) Thermal infrared data from the ASTER instrument, showing the fingerprint of each rock type as a different color.
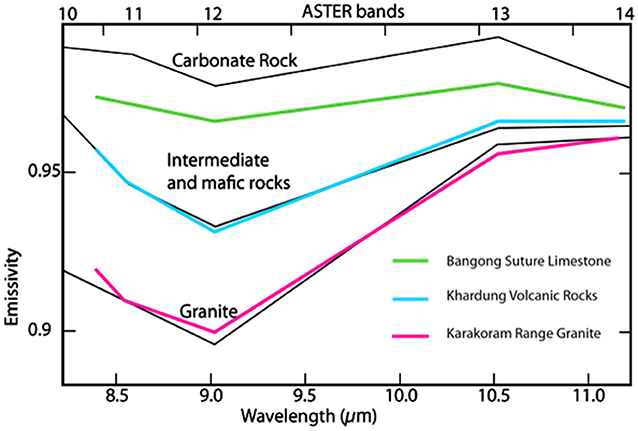
- Figure 3 - The black lines are the fingerprints of 3 kinds of rocks located in California.
- The colored lines show the fingerprint of rocks from our map in the Himalaya. The shape of the fingerprints from each of the different types of rocks match! This helps us be sure that we are doing a good job figuring out rock types using the colors in our geological map. You can find each rock type on the map by matching the name (see key) with the name shown in the map in Figure 2 (image modified from [4]).
Checking Our Work
Geological maps created with thermal infrared data need to be checked to make sure the rock type we put on our map made with the satellite data match the rock type that is really on the ground. To do this, we collected different types of rocks from areas that we could visit. Back in the laboratory, we used an instrument called a thermal emission spectrometer to measure the spectral signature of each rock. When we compared these laboratory fingerprints to those from the satellite, they matched! This gave us confidence that our geologic map was correct.
What Did Our Map Tell Us?
Our map revealed some interesting pieces of the Himalayan geologic puzzle. First, we could see many remnants of an ancient ocean, called the Tethys Sea, that once separated India and Eurasia. About 50 million years ago, these two continents collided, pushing up the seafloor and beginning the long process of making the mountains we see today [5].
Many millions of years later, a huge fault—the Karakoram—sliced through some of these remnants of the ancient ocean floor, sliding each part sideways. Because these pieces of seafloor are made of unique and unusual rocks, we could use them to show just how far the pieces had been moved by this fault over millions of years.
A fault is a fracture in the hard rocks of Earth’s crust. Earthquakes occur along faults. Bigger faults can have larger and more damaging earthquakes, so it is important to know where these faults are. Our map helped us to see the intersection of two huge faults, the Karakoram and Longmu Co faults (Figure 2A), which form the southwestern edge of the Tibetan Plateau. These faults are active today and can host strong earthquakes. Our geologic map shows which parts of the Karakoram fault are likely to have earthquakes. For instance, some scientists thought that the Karakoram had only a single active section in this area. But our map helped to show that there is another section that could also have earthquakes! This is important information for people who live in the area and need to stay safe from earthquakes.
By combining information from a satellite and from the laboratory, we made a geologic map of part of the Himalaya. This map helped us piece together part of the geologic history of the northwestern Himalaya. It also helped us identify and better understand important, active faults in the area.
Glossary
Geologic Map: ↑ A map that shows the distribution of different types of rocks using either colors or symbols. Geologic maps also include structural features, like faults.
Geologists: ↑ Scientists who study Earth’s history, especially recorded by rocks.
Thermal Infrared: ↑ Region of the electromagnetic spectrum with wavelengths between 8 to 15 micrometers.
Wavelength: ↑ The length of one complete wave cycle. The wavelength of the thermal infrared spectrum is between 8 and 15 micrometers, whereas the wavelength of visible light is 400-700 nanometers.
Electromagnetic Spectrum: ↑ The range of all types of electromagnetic radiation, ranging from long wavelengths (radio) to short wavelengths (x-ray and gamma rays). Light that’s visible to humans has wavelengths between these two endmembers.
Spectral Signature: ↑ Different surfaces emit radiation differently at different wavelengths. The variation of emission at different wavelengths forms the spectral signature that’s unique to each surface.
Thermal Emission Spectrometer: ↑ An instrument that can detect and measure light in the thermal infrared spectrum.
Fault: ↑ A break or fracture in the rocks of Earth’s crust where earthquakes occur.
Conflict of Interest
WB was employed by Dr. Wendy Rocks, LLC. AT-L was employed by Temblor.
Original Source Article
↑Bohon, W., Hodges, K. V., Tripathy-Lang, A., Arrowsmith, J. R., and Edwards, C. 2018. Structural relationship between the Karakoram and Longmu Co fault systems, southwestern Tibetan Plateau, revealed by ASTER remote sensing. Geosphere 14:1837–1850. doi: 10.1130/GES01515.1
References
[1] ↑ Yamaguchi, Y., Kahle, A. B., Tsu, H., Kawakami, T., and Pniel, M. 1998. Overview of advanced spaceborne thermal emission and reflection radiometer (ASTER). IEEE Trans. Geosci. Rem. Sens. 36:1062–1071. doi: 10.1109/36.700991
[2] ↑ Cooper, F. J., Adams, B. A., Edwards, C. S., and Hodges, K. V. 2012. Large normal-sense displacement on the South Tibetan fault system in the eastern Himalaya. Geology 40:971–974. doi: 10.1130/G33318.1
[3] ↑ Bohon, W., Hodges, K. V., Tripathy-Lang, A., Arrowsmith, J. R., and Edwards, C. 2018. Structural relationship between the Karakoram and Longmu Co fault systems, southwestern Tibetan Plateau, revealed by ASTER remote sensing. Geosphere 14:1837–1850. doi: 10.1130/GES01515.1
[4] ↑ Rowan, L. C., and Mars, J. C. 2003. Lithologic mapping in the Mountain Pass, California area using advanced spaceborne thermal emission and reflection radiometer (ASTER) data. Rem. Sens. Environ. 84:350–366. doi: 10.1016/S0034-4257(02)00127-X
[5] ↑ Searle, M. P., Windley, B. F., Coward, M. P., Cooper, D. J. W., Rex, A. J., Rex, D., et al. 1987. The closing of Tethys and the tectonics of the Himalaya. Geol. Soc. Am. Bull. 98:678–701. doi: 10.1130/0016-7606(1987)98<678:TCOTAT>2.0.CO;2