Abstract
Mathematics is very human—we all enjoy using our brains, thinking, making connections, and checking to see if our conclusions are true. For me, mathematics is also a way to experience creativity, which is what makes me happy. In this article, I want to share this delight with you, through the story of wavelets. Wavelets are mathematical tools that my colleagues and I developed, which are very useful in analyzing images and other signals like medical scans or audio files. I hope that, by the end of this article, you will see that mathematics is much more interesting and diverse than memorizing formulas and performing calculations. It is a creative endeavor that advances society and can make our lives richer and more beautiful.
Professor Ingrid Daubechies was awarded the 2023 Wolf Prize for work in wavelet theory and applied harmonic analysis.
The Mathematical Impulse
Mathematics helps us figure things out using just our brains. To me, this is truly magical. I think that all of us have a mathematical impulse because we like using our brains and thinking, we like making connections, coming to conclusions, and checking whether those conclusions are true. This is exactly what I do in my everyday work as a mathematician. I try to understand how mathematical functions work, by taking them apart and putting them back together again. This disassembling and reassembling process happens in many other activities that require learning, too. Even great comedians like Chris Rock do it to improve their acts by breaking apart successful jokes and using their parts to create new jokes! In this article, I will tell you about an achievement made using this kind of learning process—a very useful mathematical tool called wavelets.
What Are Wavelets?
Wavelets are mathematical functions that help us process and analyze images and other kinds of signals [1], including medical recordings of the body’s activities and even ripples in space itself, created by the strongest astronomical events in the universe! (To learn more about wavelets and signal processing, see this video). In the 1980’s, mathematicians, engineers, and physicists all studied wavelets simultaneously. This was an exciting time, as it was clear that each field was looking at one part of a whole concept that would be extremely useful across multiple fields.
As their name suggests, wavelets are little waves that can come in various forms (Figure 1A). Wavelets are finite, meaning that their value is non-zero only in a specific area in space. Every wavelet can be stretched or squished to make it narrower or broader and can also be shifted to the left or right along the x-axis (Figure 1B), in order to be matched to the analyzed signal. You can think of wavelets as building blocks with which we can reconstruct and analyze signals and images.
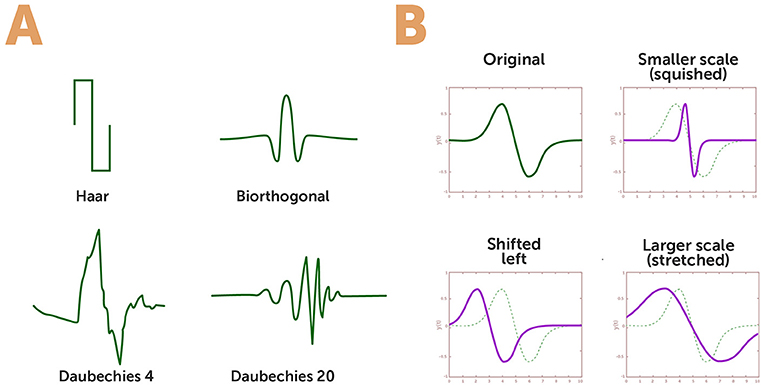
- Figure 1 - Families of wavelets.
- Wavelets are small waves that can come in various forms. (A) Four different types, or “families,” of wavelets which have different properties and are used for different applications. I developed the bottom two that are called after my name (Daubechies 4 and 20). (B) Every wavelet can be scaled to be smaller or larger (“squished” or "stretched;” see original wave in dotted green and new wave in purple). Wavelets can also be shifted along the x-axis (for example, shifted left as you can see in the bottom left).
Once we have a signal or an image that we want to analyze, we can figure out which wavelets are most similar to the patterns in the signal (Figure 2). Importantly, we can adjust the scale to “zoom in” to see smaller details of the signal (squish the wavelet), or to “zoom out” to get a broader view (stretch the wavelet). Then, using some mathematical tricks, we can use wavelets to either get certain information out of the signal or image, like whether it contains a specific shape or pattern we are looking for, or compress that signal or image—meaning to save the image using only a small part of the original memory space, which still gives us enough information for our purpose.
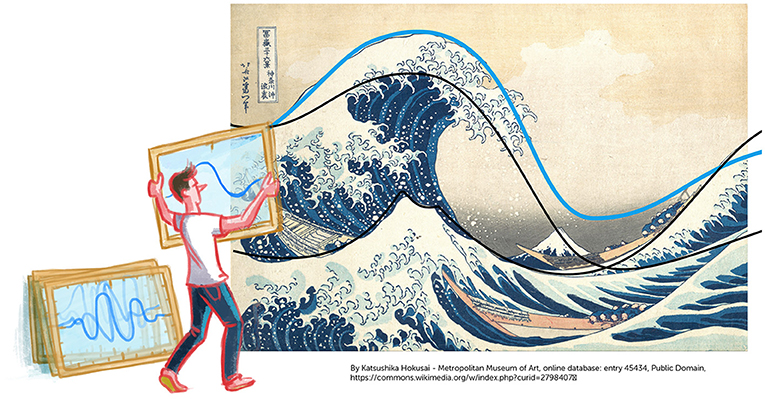
- Figure 2 - Using wavelets to detect patterns.
- We often use wavelets to analyze patterns in signals and images. In this artistic representation, the man is using wavelets to study the wave pattern in the painting The Great Wave off Kanagawa by Katsushika Hokusai. As you can see on the left, the man has frames with different wavelets and he is searching for the wavelet that would best suit the shape of the wave in the image.
Wavelets as Tools for Image Processing
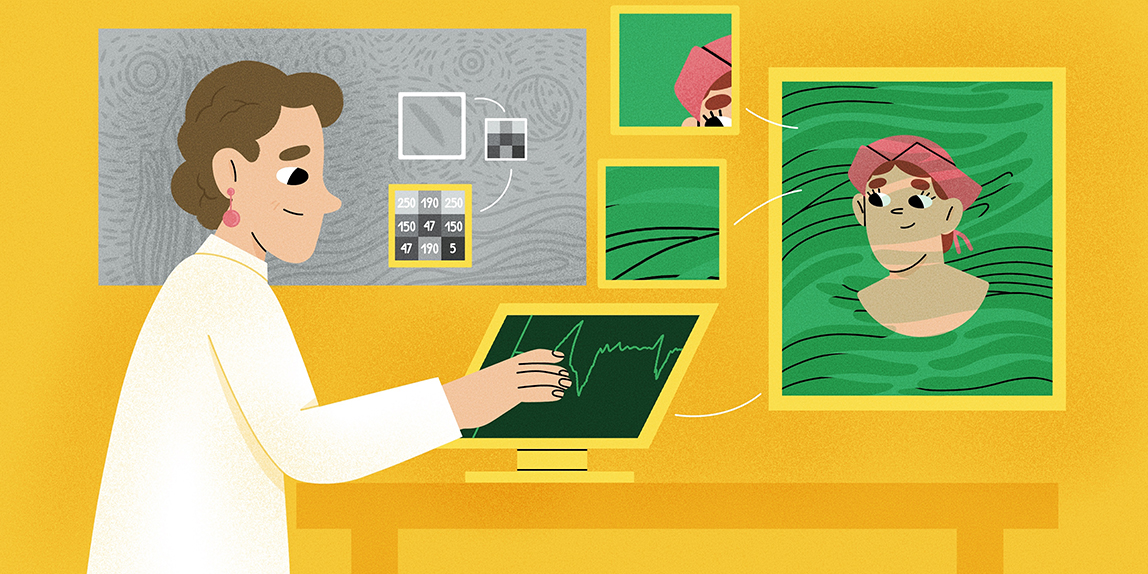
As you may know, images are represented in computers as sets of numbers (Figure 3A). In a grayscale image, the color of each pixel is represented by one number, often in the range of 0–255 (Figure 3B). The number 0 represents the color black, and 255 represents white. All the numbers in between are various hues of gray (if the image is colorful, then we use three numbers to represent the three components of the color—red, green, and blue). Computers represent all information using only two states: “0” and “1”. Each “0” or “1” unit is called a bit, and each bit can represent the two states. When we combine two bits, since each of them can independently represent two states, both of them together can represent 22 = 4 states. If we want to represent 256 numbers (from 0 to 255), we need a system of 8 bits (28 = 256). A typical rectangular digital image is formed of 512 rows, each having 512 pixels, so 512 × 512 = 262,144 pixels overall. Each pixel is represented by 8 bits, so we need 262,144 × 8 = 2,097,152 bits, or units of information, to represent only one typical greyscale image (For colored images, we need three times as many)!
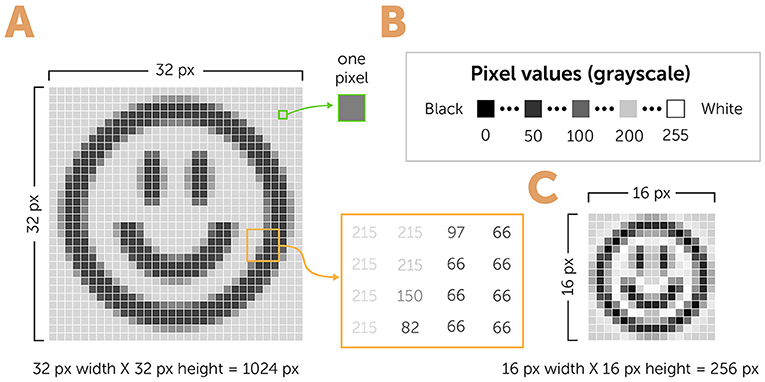
- Figure 3 - Representing images in computers.
- (A) Images are represented in computers as sets of numbers—one number for every pixel (px). Lower numbers are darker and higher number are brighter (yellow square representing 16 pixels in the image). (B) In grayscale images, the numbers usually range from 0 (black) to 255 (white). (C) To save computer memory, we can compress images by averaging every two neighboring pixels to get one combined pixel with the average color value.
That is a huge amount of information, especially if we think about movies, in which we have 25 images per second, each represented by millions of bits. We must often find ways to decrease the amount of computer memory needed to store images, without losing important information. To do so, we can try to compress the image and reduce the number of pixels stored in memory. A simple way of doing this is to take every two neighboring pixels in an image, calculate the average number of their colors, and save only one pixel with that average color number (Figure 3C). By doing this, we decrease the number of pixels of an image by a factor of two horizontally (for neighboring pixels in every row) and by a factor of two vertically (for neighboring pixels in every column). We can repeat this process many times and produce a very small image.
When we do this averaging, we lose important information that was contained in the original image—information that might make a reconstructed image blurrier. If we do not want to lose that information, we must ensure that we can reconstruct the original image from the averaged image. To do that, we also save the differences between the original pixels that we averaged, because it is possible to find the original numbers from the average and the difference of the two numbers. It turns out that we can represent these averages and differences using wavelets! If we take the averages and differences only between two near neighbors, we get a staircase-like wavelet (Haar wavelet in Figure 1A). Often, we want to combine larger groups of neighboring pixels, which means each averaged pixel will contain more information. When we do that, we get other wavelets that are smoother (Daubechies 20 wavelet in Figure 1A).
Wavelets can show us the most important parts in our image, which will be areas of the image where “something is happening,” like boundaries. Wavelets can give us information about general trends in the values of pixels in our image, and about the horizontal, vertical, and diagonal details or sharp changes in color. Wavelets are better at analyzing sharp changes in images (and other signals) compared to other common signal-analysis methods. Wavelets let us identify and save only important features of the image, where there are large changes, and discard information about uniform areas. The information we save about the important features is enough to allow us to reconstruct a fairly accurate version of the original image. Saving as little as 10% or even 3% of the original data can often be enough to reconstruct a pretty good version of the original image (see this video and check whether you can notice the differences between the various compressions).
I developed wavelets that are particularly useful for image analysis. While most scientists looked at known wavelets and tried to change them to make them useful for image analysis, I first looked at the image-analysis task at hand and asked: which properties should wavelets have to be useful for this task? Based on these properties, my colleagues and I constructed a completely new family of wavelets [2]. We then showed how wavelets can be used for image processing and compression [3]. Our suggestion turned out to be very useful, and it was applied in a method that is called the JPEG2000 image compression standard [4, 5]. JPEG2000 is widely used in the compression of high-resolution images, in many applications on the internet and for digital movies.
Wavelets in Interesting Places
Wavelets are a powerful tool for analyzing signals and images. In principle, they can be used in any situation for which signal analysis is required, including in the fields of astronomy [for automatic selection of the best-focused images of astronomical objects [6]]; forensics [for detecting manipulations of digital audio files, images, and videos [7]]; and medicine [for detecting heart diseases that cause irregular blood supply to the heart [8]]. With time, as we install more and more sensors in our environments and collect an increasing amount of data that we want to store, I expect that wavelets will have an even bigger role in many applications.
I am currently working with colleagues on using wavelets for interesting and perhaps quite surprising applications. In one of my projects, for example, I am working with art historians. We use wavelets to analyze paintings and understand their history. Specifically, we are trying to get the best possible view of hidden layers, called underpaintings, that are beneath the visible paintings (Figure 4A). After we have identified an underpainting using x-rays, we use wavelets to “expose” the details of the underpainting and reconstruct it as accurately as possible. We can also use wavelets for other applications in art, such as studying and removing (or generating) cracks in digital images of paintings (Figure 4B) and rejuvenating aged colors.
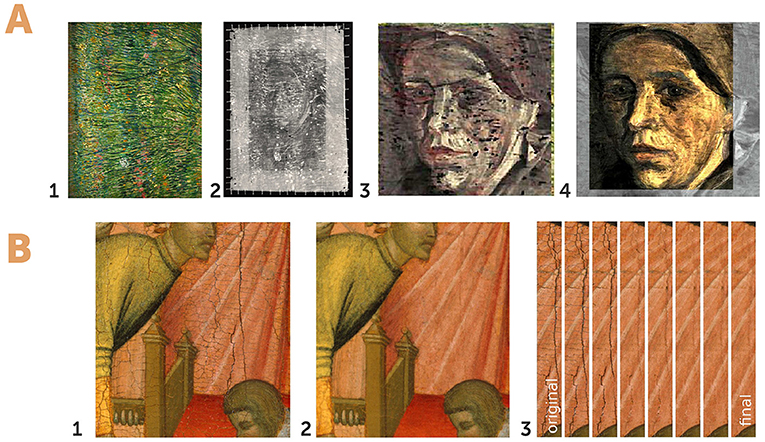
- Figure 4 - Applying wavelets to art.
- Wavelets can be used for varied applications, including art conservation and restoration. (A) Some paintings, such as Patch of Grass by Van Gogh (1), have other paintings beneath them, called underpaintings (2). We can uncover these underpaintings using x-rays, and then use wavelets to reconstruct the original image (3–4). (B) We can also use wavelets to remove cracks from digital images of old paintings (1–2) through performing wavelet analysis multiple times (3).
To end, I would like to share with you an important lesson I learned from working on mathematical problems. To solve a mathematical problem, you must try to solve it over and over again, approaching it from multiple “sides.” This is similar to sports, in which you have to work hard and make an effort to get better—but the fact that it is hard does not mean it is impossible. So, keep trying and keep using your creativity to find novel, beautiful ways to understand the things around you, and be sure to share your insights with others.
Glossary
Wavelets: ↑ Mathematical functions used for processing signals and images. The word “wavelet” means a small wave.
Compress (DATA): ↑ Save only the necessary part of the data.
Pixel: ↑ The smallest unit of color (tiny circle) in digital images.
Image Processing: ↑ Performing mathematical operations on digital images to get useful information out of them.
JPEG2000: ↑ An image compression method based on Daubechies wavelets, which is widely used on the internet and in digital movies.
Conflict of Interest
The author declares that the research was conducted in the absence of any commercial or financial relationships that could be construed as a potential conflict of interest.
Acknowledgments
I wish to thank Or Raphael for conducting the interview which served as the basis for this paper and for co-authoring the paper, and Alex Bernstein for providing the figures.
Additional Materials
- Compression Applet—Using Wavelets to Compress Files (Duke University).
- Using Math to Understand Art. Ingrid Daubechies. TEDxDuke.
- Mathemalchemy—A unique and collaborative art exhibit exploring the beauty of mathematics.
- How Wavelets Let Researchers Transform and Understand Data.
References
[1] ↑ Daubechies, I. 1992. “Ten lectures on wavelets,” in CBMS-NSF Regional Conferences Series in Applied Mathematics (Philadelphia, PA: SIAM). p. vii.
[2] ↑ Cohen, A., Daubechies, I., and Feauveau, J. C. 1992. Biorthogonal bases of compactly supported wavelets. Commun. Pure Appl. Math. 45:485–560.
[3] ↑ Antonini, M., Barlaud, M., Mathieu, P., and Daubechies, I. 1992. Image coding using wavelet transform. IEEE Trans. Image Process. 1:205–20.
[4] ↑ Usevitch, B. E. 2001. A tutorial on modern lossy wavelet image compression: foundations of JPEG 2000. IEEE Sign. Process. Mag. 18:22–35. doi: 10.1109/79.952803
[5] ↑ Unser, M., and Blu, T. 2003. Mathematical properties of the JPEG2000 wavelet filters. IEEE Trans. Image Process. 12:1080–90. doi: 10.1109/TIP.2003.812329
[6] ↑ Kautsky, J., Flusser, J., Zitova, B., and Šimberová, S. 2002. A new wavelet-based measure of image focus. Pat. Recogn. Lett. 23:1785–94. doi: 10.1016/S0167-8655(02)00152-6
[7] ↑ Farid, H., and Lyu, S. 2003. “Higher-order wavelet statistics and their application to digital forensics,” in 2003 Conference on Computer Vision and Pattern Recognition Workshop, Vol. 8 (Madison, WI: IEEE). p. 94.
[8] ↑ Akay, M. 1997. Wavelet applications in medicine. IEEE Spectr. 34:50–6.