Abstract
The organisms that live in the ocean range in size and type from microscopic plankton that use sunlight to produce energy to large whales that eat other microbes and animals for fuel. These organisms coexist in a vast ocean that covers nearly three quarters of the Earth’s surface. Scientists who study the ocean face a challenge when they try to count and describe all of these different types of organisms: how can they choose the right tools and technologies to accurately measure these organisms and their environments? When scientists consider which tools and technologies to use to answer their questions about the ocean, they have to balance the cost of the measurement with the information they will get from the measurement. Here, we describe some of the different methods that scientists might use to study living things in the ocean, from nets or bottles used to collect water samples that are brought back to the boat or the laboratory, to robots that swim up and down and collect information about the deeper ocean, to remote satellites that send signals back to Earth about the surface of the ocean. There are even ways for kids to get involved and help with ocean observation!
Organisms in the Ocean Are Difficult to Study!
The ocean covers more than 72% of the Earth’s surface and averages about 3,700 m in depth. How could we ever attempt to study such a large volume of water that contains so many different living things?
Oceanographers (scientists who study the ocean) use a number of different tools to study the ocean, spanning from satellites that can observe the ocean’s surface daily, to research vessels (there are currently about 400 vessels operated by 50 different countries [1]), to robots that sink and rise periodically and are equipped with sensors (there are about 5,000 robots in use now). Most of these tools measure physical properties of the ocean, like the temperature and saltiness of the water, with nearly one in ten also collecting information about life in the ocean.
The ocean contains organisms of all sizes, from tiny organisms of 0.2–20 μm that are too small to see with our eyes (1 μm is one millionth of a meter, m), such as bacteria, most phytoplankton, and small zooplankton, up to larger organisms of 0.2–20 m, such as most fish and marine mammals. The mass of the tiny organisms is approximately the same as the mass of the organisms we can see [2]—there are lots of tiny organisms in the ocean! For example, in a teaspoon of ocean water, there are about 5 million bacteria and about 250,000 phytoplankton (organisms that use light to grow), and possibly one large zooplankton (zooplankton eat other organisms; some look like the character “Plankton” on Spongebob). The size difference between zooplankton and bacteria is like the size difference between the Eiffel Tower and a human! While tiny bacteria can multiply every few hours, large zooplankton need to find a mate to reproduce and live for about a year.
Different Methods Are Needed to Study Different Ocean Organisms
Since the organisms that live in the ocean come in many sizes, from very tiny to very large, oceanographers cannot use the same methods to study all ocean organisms. For example, tiny phytoplankton, which are found everywhere in the sunlit ocean, are the source of energy for the marine food web. Phytoplankton serve as food for other organisms and thus are important to study. But oceanographers cannot study phytoplankton the same way that they would study a top predator like an Orca whale, for example. While phytoplankton are always everywhere in the sunlit ocean, there may only be a single whale in a whole bay at any one time. Phytoplankton are too small to count with our naked eyes, but a large whale would be easy to spot without any other tools.
To study the smallest organisms, such as bacteria, phytoplankton, and zooplankton, oceanographers use boats to collect water samples to study in the lab. They might look at these organisms with microscopes or use a special laser beam to figure out the number, size, and type of cells present in the sample. In the same way that humans might look at their own DNA to find out where their ancestors came from and what they might have looked like, scientists look at the genetic material of the organisms collected from ocean water samples to find out what type of organisms are in the water. To do this, scientists need to decode the genetic material to see if it matches other known organisms whose genetic codes have been previously studied and put in a library of genetic codes.
DNA can also provide information about the character of the organisms collected from the ecosystem—like whether or not the organisms can survive without oxygen. Water samples may also be analyzed for special substances contained in certain organisms. For example, oceanographers often look for a molecule called chlorophyll a in their water samples. Chlorophyll a is a pigment used by phytoplankton to collect sunlight for energy, just like trees do on land. The amount of chlorophyll a in the water is one measure of how many phytoplankton are in the water.
Phytoplankton in the surface waters of the ocean affect the color of the water (Figure 1). Satellites looking down on Earth take pictures of the surface of the ocean. Scientists use these pictures to map the distribution of phytoplankton. Even though they are too small to see with our eyes, a large number of phytoplankton (called a bloom) occupying a large area can clearly be seen from space.
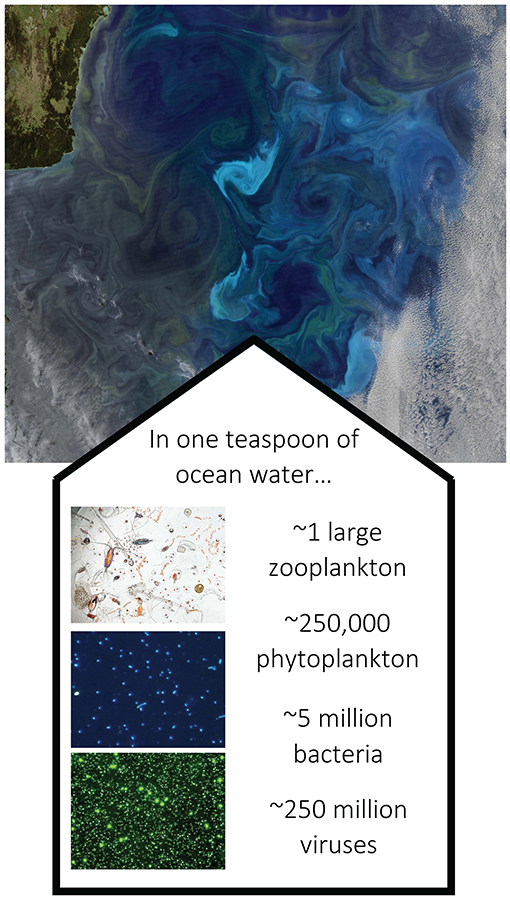
- Figure 1 - A color photo of the ocean taken from a satellite, showing swirls and eddies with widely different concentrations of chlorophyll a, a pigment shared by all phytoplankton.
- The areas that are greenest represent areas with more chlorophyll a, hence more phytoplankton. The text below the photo describes the large differences in concentrations of the various types of planktonic organisms present in one teaspoon of ocean water. The satellite image is from: https://oceancolor.gsfc.nasa.gov/gallery/.
To study larger organisms, such as the zooplankton that eat phytoplankton, scientists deploy cameras from research vessels, robots, or submarines. These cameras take pictures of the organisms present in the water. Ocean water is a good transmitter of sound. Oceanographers use acoustic sensors, which send a pulse of sound, and listen for its return, to map the distributions of zooplankton and fish. This method works because these organisms scatter the sound back to the sensor differently, depending on their size and shape. Listening for animal sounds is another way to study the distribution of organisms that produce sounds, such as whales. Whales have been known to “talk” to each other over thousands of kilometers!
Finally, nets are also used to collect organisms from different depths (Figure 2). This method is similar to the way a fishing boat catches fish in the ocean. The nets have a mesh, which is made up of many holes stitched together. Depending on the size of the holes, different marine organisms are caught in the nets, varying in size from phytoplankton to large fish.
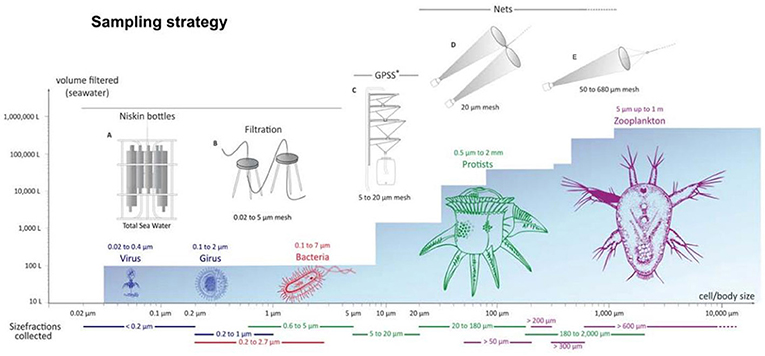
- Figure 2 - Different methods must be used to collect samples of ocean organisms of varying sizes. When we conduct a holistic sampling.
- Tiny organisms, like viruses, are collected using different types of filtration systems to remove them from ocean water. Zooplankton, which are more than a million times bigger than viruses, are collected using nets deployed in the ocean. This graph shows the amount of water (on the left axis) needed to be filtered to collect organisms of different sizes and types (on the bottom axis). Above the organisms, pictures of the specific filtration systems and water sources (whether bottles or nets) denoted with A–E are displayed. From Karsenti et al. [3].
Robots Can Be Used to Collect Data From the Ocean
Traditionally, oceanographers studied ocean organisms using boats equipped with nets and water collectors (large bottles that can close at a given depth, so water from the deep ocean can come up to the surface undisturbed). Also, automatic sensors can be deployed from ships or from robots. Like different types of boats, marine robots use different strategies to move around. Some marine robots move using motors, some have sails, and some change their depth in the water by changing their buoyancy (whether they sink or float). Currently, there are thousands of these marine robots roaming around the ocean (for pictures of some of them see Figure 3), many of which send their data back to shore through satellites. In this way, oceanographers can observe the ocean while staying on shore.
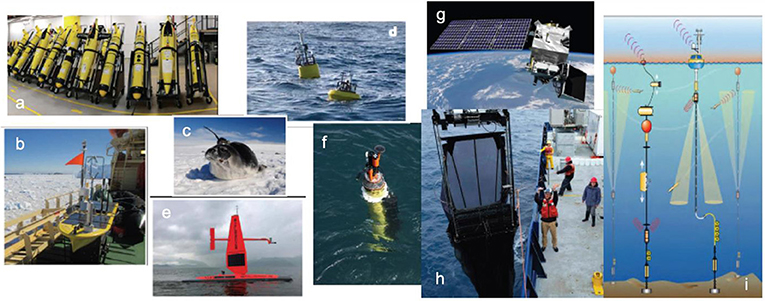
- Figure 3 - Examples of sampling platforms.
- Autonomous (independent) platforms include Gliders (a), wave gliders (b), marine organisms with attached sensor, such as seals (c), Surface drifters (d), sail drones (e), and profiling floats (f). All of these contain sensors to study the ocean and have no motor (the sensors and communication devices are powered by batteries). Satellites monitor the energy reflected or emitted from the Earth (g). Ships with nets and other sampling system collect samples for lab analysis (h) while fixed mooring instrumented with sensors collect data at their location (i). Photo credits for figure: (a) ALPS II report (https://alps-ocean.us/documents/). (b) A. Snyder, in ALPS II report. (c) D. Costa, in ALPS II report. (d) ALPS II report. (e) Saildrone Inc., in ALPS II report. (f) E. Boss, University of Maine. (g) NASA PACE project photo gallery (https://pace.oceansciences.org/gallery.htm). (h) NASA PACE project photo gallery (https://pace.oceansciences.org/gallery.htm). (i) https://oceanobservatories.org/.
To understand why the numbers of some organisms vary in different parts of the ocean, oceanographers collect a variety of data from the environment. These data include the water temperature and amount of light at the depth where the sample was collected, the presence and amount of predators, as well as the presence of chemicals that may affect the organisms. Some of these chemicals, like dissolved nutrients, are beneficial to phytoplankton, and act like fertilizer does for plants on land. Others, like those chemicals that make the water acidic, may be bad for organisms. In acidic water, some organisms will have a hard time building a shell, for the same reason a tooth dissolves in a glass of Coca Cola.
To study the interactions between the organisms present in a certain area of the ocean, oceanographers need to take a holistic sampling approach. A holistic approach means that every part of the food web and the environment are considered together. To look at an area of the ocean holistically, all parts of the food web need to be measured at the same time. For instance, if oceanographers determine that phytoplankton in a certain area have enough light and nutrients to grow, it would be difficult to explain why the number of phytoplankton was not increasing, unless there are also measurements of the number of herbivores that are eating the phytoplankton as they grow.
Challenges to Studying Marine Organisms
Because the ocean is so large and because it changes over time, studying marine organisms can present many challenges for oceanographers. One difficulty that scientists run into when trying to study the ocean is called biofouling. Biofouling happens when organisms colonize (start to grow on) sensors and sampling platforms, resulting in bad measurements. Organisms in the ocean are often looking for a surfaces to grow on, and oceanographic sensors provide a perfect place for seaweed or barnacles to grow.
Another difficulty is the fact that organisms, such as fish are attracted to structures or lights in the ocean, which might possibly affect the measurements from those instruments. Fisherman know that the fish are attracted to these places, and will come to fish near ocean moorings. This effect demonstrates a challenge in oceanography: when we measure the ocean, we sometime change it.
Because the amount of money available to do oceanographic studies is limited, scientists need to think carefully about the questions they are asking and how they can get the right information to best answer these questions. A good scientific study will consider the characteristics of the organisms of interest. Oceanographers may ask questions like:
- How much water should I analyze to know the concentration of Organism X? If I only count one bucketful of water, will I get enough organisms to guess how many organisms are in this whole bay?
- For how long will the measurements I made hold true? If I took this sample 1 week ago, are the same organisms still in the water today, or have their numbers changed?
- How much of the ocean does this measurement represent? Can I say something about the whole ocean with my measurement, or just about the bay that I studied?
Answering questions like these is key to deciding how much, how often, and how far apart measurements should be made. This strategy will ensure that research money is well spent. The good news is that developments in technology over the years have helped drive down the costs of some of these measurement methods, as well as increase the amount of information oceanographers can gather from one measurement. If scientists cannot answer their research questions without a specific measurement and this measurement can only be made from a boat, then they should ask for time and money to go to sea on a research vessel. But maybe their question can be answered using satellite data that is collected every day all over the globe and a boat is not needed. This solution could possibly save money.
How Can We Improve Measurements of Organisms in the Ocean?
To further expand ocean measurements, scientists need help. Some recent programs have non-oceanographers (including kids) taking measurements of the ocean. These “citizen science” programs have the potential to greatly increase our ability to sample the ocean. Many people care deeply for the ocean—they love going to the beach, swimming in the ocean, and appreciating the animals that live in the sea. The ocean is enormous, and there are only so many oceanographers (including the robots!) that can sample the ocean at a time. So, we need the help of people who care about the ocean to collect samples and share observations about the sea. Useful data can even be gathered by surfers (https://smartfin.org/)! If you are interested to join such a citizen science program, to help oceanographers collect data about the sea, take a look at the following links to see how you can help!
https://oceanservice.noaa.gov/citizen-science/ or
https://planktonplanet.org/ or
https://medium.com/@TheW2O/citizen-science-and-the-ocean-4dff1b7e0d84
Glossary
Satellite: ↑ An object in space that rotates around the Earth and on which sensors can be attached to observe the Earth.
Robot: ↑ An object that has some control of its own motion and on which sensors can be attached.
Sensor: ↑ An object with electronic components that records signals generated from the environment around it.
Phytoplankton: ↑ Microscopic, single-celled organisms that use sunlight, dissolved gases, and nutrients for energy and to build cellular material.
Zooplankton: ↑ Animals that eat microbes for energy and to build cellular material.
Holistic Sampling: ↑ A method of sampling where all part of a system of interest are sampled at the same time.
Conflict of Interest
The authors declare that the research was conducted in the absence of any commercial or financial relationships that could be construed as a potential conflict of interest.
References
[1] ↑ Dinsmore, R. P. 2001. “Ships,” in Encyclopedia of Ocean Sciences, 2nd Edn., ed J. H. Steele (Academic Press). p. 409–18. doi: 10.1016/B978-012374473-9.00299-X
[2] ↑ Sheldon, R. W., Prakash, A., and Sutcliffe, W. H. 1972. The size distribution of particles in the ocean. Limnol. Oceanogr. 17:327–40.
[3] ↑ Karsenti, E., Acinas, S. G., Bork, P., Bowler, C., De Vargas, C., Raes, J., et al. 2011. A holistic approach to marine eco-systems biology. PLoS Biol. 9:e1001177. doi: 10.1371/journal.pbio.1001177