Abstract
How do different parts of the brain work together to help us see, move, understand, and do other things? For many years, we have known that different brain regions perform different tasks that are important for vision. Some brain regions are responsible for seeing faces, colors, lines, movement, or other parts of the world. But mapping different brain regions in detail is very challenging, especially because everyone’s brain is slightly different. Sometimes, brain surgeons must place electrodes inside a patient’s skull—on the surface of the brain—to get a more detailed map. This article describes a study done by a group of brain surgeons, scientists, and engineers. We studied the activity of a patient’s brain while he looked at different objects. We identified two brain regions that were active when the patient processed faces or colors. If we stimulated these areas, the patient reported seeing faces or colors, even if he was looking at something else! The results of this study help show how different parts of the brain perform different tasks, and could lead to safer, more precise brain surgery.
How Can Doctors and Scientists Find Regions in the Brain That Perform Certain Functions?
The human brain is responsible for many functions, and certain brain regions are responsible for specific tasks, as shown in Figure 1. For example, the part of the brain called the motor cortex controls movements of the fingers, hands, legs, arms, and other body areas. The motor cortex has a lot of brain tissue for hand and finger movement, which we need for writing, holding a screwdriver, or threading a needle. On the other hand, we do not have very precise control of our leg muscles, and so the motor cortex can control leg movement without quite so much brain tissue. Another important brain region is the somatosensory cortex, which is responsible for the sense of touch. Without touch, it would be very difficult to know how much to tighten a screw, or to hold fragile items like grapes or a bottle of Coke. People might accidentally crush the grapes or the Coke bottle without feedback from the brain about how much force their hands produce. The auditory cortex is responsible for hearing, and this information is then passed to a region called Wernicke’s area, to help make sense of what you are hearing. If your teacher asks you, “Did you do your homework?” then the sounds go from the ear to the brain, where the auditory cortex passes the information to Wernicke’s area. Wernicke’s area is responsible for understanding the question, and then your brain can silently formulate a “Yes.” The formulation of words is done in another brain area, called Broca’s area. Finally, your brain uses the motor cortex to move your lips, tongue, and throat to allow you to tell your teacher “Yes.” Other brain regions are responsible for processing things you see, recognizing faces and colors, and the memory enables you to remembering things.
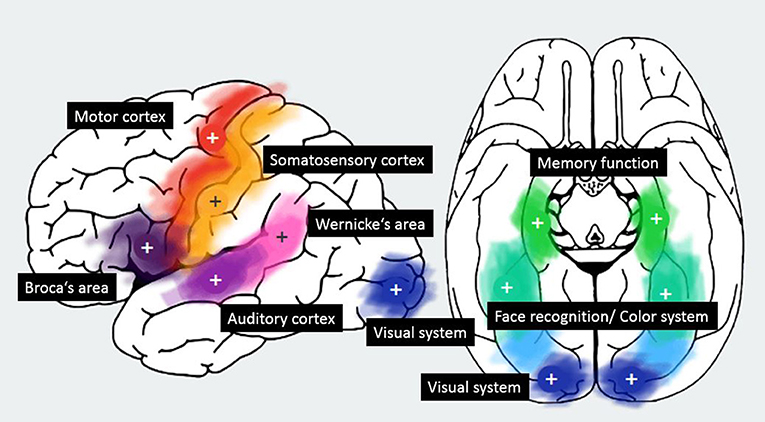
- Figure 1 - Most important brain regions with a + in the center of the region.
The brain regions that are responsible for these complex tasks are in slightly different locations in each person. We can say where brain regions can be found in general—for example, the primary visual area is in the back of the head—but it is much harder for doctors and scientists to map different parts of the brain precisely, such as within one millimeter. In some cases, when doctors need very precise brain maps to perform brain surgery, a brain surgeon will implant electrodes on the patient’s brain surface to record brain activity. Then, the doctors perform small experiments on the patient to find the specific brain areas that perform different tasks.
Figure 2 shows one example of one such an experiment, used to find the cortical regions responsible for creating images of faces, body parts, digits, Hiragana characters (used in Japan), Kanji characters (also used in Japan), line objects, and other objects. We showed the patient these images in color and in black and white. The patient concentrated on each image for a very short time, 200 ms (a millisecond is 1/1,000 of a second). After 600–800 ms, the next image was shown. Between images, the computer screen was just black. We showed the patient 20 different images of each type.
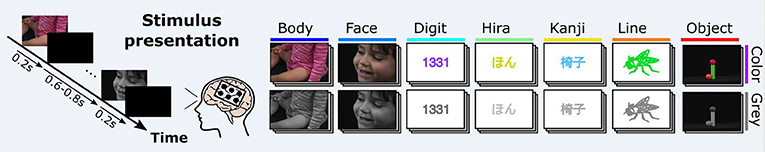
- Figure 2 - The patient had electrodes implanted directly on the cortex (black dots over the brain) and saw 20 different color or black and white images of each type, for 200 ms each.
- Between the images there was a break of 600–800 ms. The images were body parts, faces, digits, Hiragana characters, Kanji characters, line drawings or objects. Meanwhile, we recorded the patient’s brain activity to see which brain regions responded to the images that the person saw.
While the patient saw these images, we recorded brain activity with little disks made of platinum, called electrodes that had been placed on the surface of the patient’s brain by a brain surgeon. The outer surface of the brain is called the cortex, so the electrodes recorded information from the brain’s cortex. These electrodes typically have a diameter between 1 and 4 mm, which is very small. The small size of the electrodes allows activity from the cortex to be recorded very precisely, providing the best map for the brain surgeon and medical team. The electrodes were connected to a special amplifier through a tiny wire. This device amplified the very small brain waves and sent the data to a computer for further analysis. To map large regions of the brain and identify many different functions, brain surgeons may implant between 16 and 256 electrodes. The electrodes are mostly arranged in squares, and therefore they are called electrode grids. These grids are then put over brain regions that the surgeon needs to map in order to help each patient.
Figure 3 shows what we learned from studying the patient’s brain while he looked at images of faces, body parts and other objects. The patient had 256 electrodes implanted all over the brain, but only the electrodes on the bottom of the brain, in a region called the fusiform face area, were active when the patient looked at the images. Figure 3 shows that one electrode grid with 20 electrodes was located on the right side of the brain, and another electrode grid was located on the left side. Each electrode had a specific number, which allowed us to identify where it was located. Red circles indicate cortical regions that recognize faces, and blue circles show cortical regions that recognize colors. Electrodes that did not react to faces or colors are just shown as little white circles. Larger circles show that the electrode was more important than electrodes with smaller circles. For example, when recognizing faces, electrode 181 was more important than 184, and much more important than 175. Interestingly, both sides of the brain were involved in recognizing faces or colors. To calculate the little circles, we used a complex procedure called high-gamma mapping, which looks at very tiny brain waves [1]. The fact that the brain waves are so tiny is why the electrodes must be implanted. We can learn a lot about the brain from electrodes placed outside the head, but the scalp, blood, and skin make it very difficult to map the brain using high-gamma mapping.
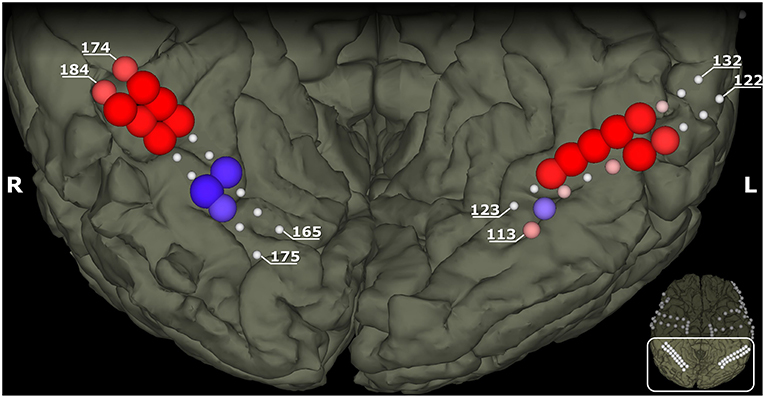
- Figure 3 - These images show the bottom of the brain with its left and right sides.
- The bottom right shows where many electrodes were implanted (white dots). The main image provides a closer view of the area in the white box, showing of 20 electrodes over each side of the brain. Each electrode has also a certain number ranging from 165 to 184 on the right side of the brain (R), and from 113 to 132 on the left side (L) of the brain. Brain regions that respond to faces are shown with red circle, and larger circles mean that the region was more active when the patient was observing faces. Similarly, blue circles show brain regions that respond to color. The white dots in the main image show brain regions that did not respond to faces or colors.
Why Do We Need These Brain Mapping Results?
The red and blue circles are very important for brain mapping. The brain surgeon can use this map to identify which brain regions are responsible for different tasks. For example, if the areas of the patient’s brain that respond to faces were removed during surgery, then he would not be able to recognize faces anymore. The patient would not recognize his mom, dad, sisters, teacher, or other people.
More broadly, why do patients need brain surgery to remove part of the brain? One reason is to remove a brain tumor. If brain tumors are not removed, they could grow and damage other parts of the brain, and eventually could be fatal. Another reason to do brain surgery is to remove a part of the brain that causes epileptic seizures. Although most people with epilepsy can use medication or other methods to reduce their seizures, some people do not respond to medication and may have seizures frequently.
New tools for more precise, detailed brain mapping can reduce two types of risks from brain surgery. First, the brain surgeon might accidentally remove too much brain tissue. As Figure 3 shows, removing only a few millimeters of brain tissue could permanently damage the patient’s ability to recognize faces or colors. Second, the brain surgeon might remove too little tissue. Then, the patients might not be cured of their tumors or seizures.
How Can We Produce Illusions With Brain Stimulation?
We also used a method called electrical cortical stimulation with the same patient. This means that we stimulated the brain with a weak electrical current, just high enough to produce a reaction in the brain. This method can help doctors identify brain areas that are likely to create seizures and can also help us learn more about the functions of different brain regions.
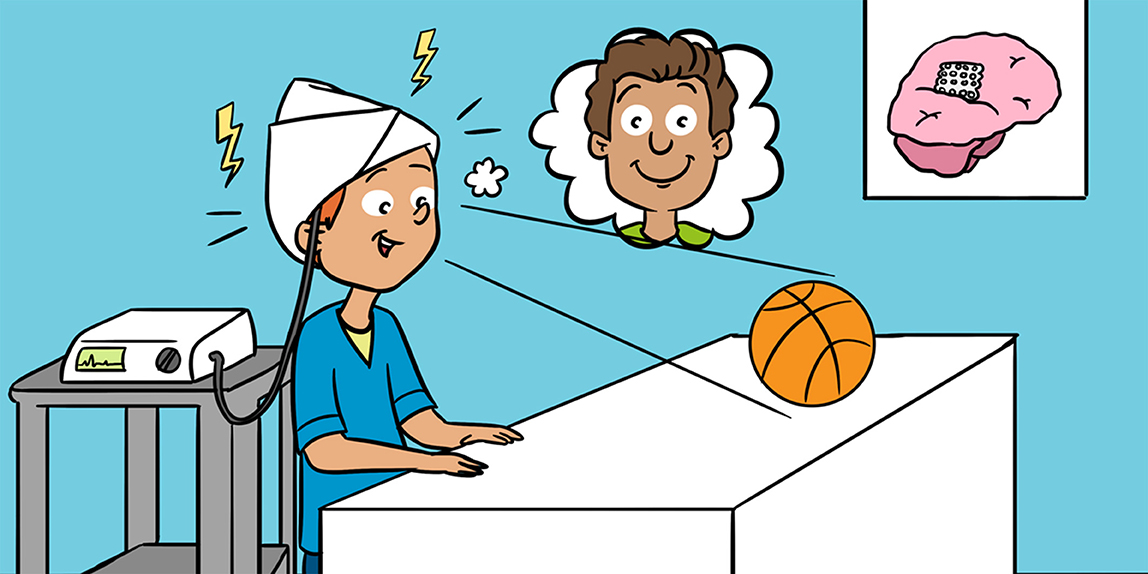
So, we created another experiment where the patient saw a black box, a ball, Dr. Ogawa’s face, or a paper with Kanji characters. While the patient looked at these things, we stimulated the face region of the brain, between electrodes 181 and 182. Figure 4 shows what the patient said that he saw while he was looking at the different objects. This stimulation caused the patient to see illusions of faces! The patient reported seeing faces even when he looked at the black box, the ball and the paper. We thought it was funny that the patient said he saw a zombie face when he saw Dr. Ogawa’s face. This illusion did not look like a realistic face, but the patient knew that it is a face.
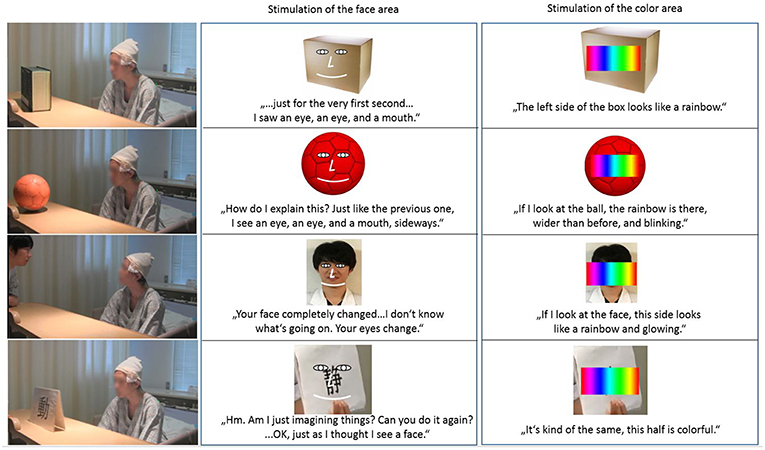
- Figure 4 - While the patient viewed a black box, a basketball, Dr. Ogawa, or a sheet of paper with a Kanji character, the experimenter stimulated regions of the brain with very low electrical current.
- When electrodes 181–182 were stimulated, the patient reported seeing a face on the black box, on the ball, and on the paper. The patient also reported that Dr. Ogawa’s eyes and mouth changed. When the current was sent from electrodes 177–178, then the patient reported seeing a rainbow on the black box, the ball, on Dr. Ogawa’s face, and on the paper.
Next, we activated the cortical regions responsible for color, by stimulating electrodes 177–178. Figure 4 shows the results. This electrical stimulation produced rainbows over the black box, the ball, paper, and Dr. Ogawa’s face.
Why Is This Brain Research Important?
As we mentioned before, the work in this article was performed primarily for medical reasons. The patient had already decided to have brain surgery, and we worked with the surgical team to help provide a good tool to help them perform a very difficult surgery without error. We are happy to say that the patient’s surgery was successful.
This work could also help patients by leading to better brain-computer interfaces. People who are completely paralyzed have used brain-computer interfaces to help them spell, browse the internet, produce art, or control devices. If we can create better maps of the brain, we can build brain-computer interfaces that are faster, more accurate, and more flexible.
This work is also important for scientific reasons. We showed that certain parts of the cortex that help us see faces are not involved in seeing color, and vice versa. We showed that faces or rainbows can be produced by stimulating very specific regions of the brain. Furthermore, the face and rainbow illusions appeared on top of the images that the patient saw. This has important consequences for helping us understand how different parts of the brain work together to help us see and perform other tasks.
Glossary
Cortex: ↑ Outer surface of the brain.
Electrode: ↑ Little disk made of platinum to record brain activity.
Millisecond: ↑ 1/1,000 of a second.
Electrode Grids: ↑ Several electrodes arranged in a square format.
High-Gamma Mapping: ↑ Way to identify most important brain centers.
Seizure: ↑ The brain is uncontrollable active and evoke involuntary movements of the body.
Epilepsy: ↑ An illness where the brain is too active.
Conflict of Interest Statement
The system producing the red and blue circles is called cortiQ and is produced by a company called CK works for g.tec in Austria. CG is the CEO. The remaining authors declare that the research was conducted in the absence of any commercial or financial relationships that could be construed as a potential conflict of interest.
Original Source Article
↑ Schalk, G., Kapeller, C., Guger, C., Ogawa, H., Hiroshima, S., Lafer-Sousa, R., et al. 2017. Facephenes and rainbows: causal evidence for functional and anatomical specificity of face and color processing in the human brain. PNAS 114:12285–90. doi: 10.1073/pnas.1713447114
Reference
[1] ↑ Kapeller, C., Ogawa, H., Schalk, G., Kunii, N., Coon, W. G., Scharinger, J., et al. 2018. Real-time detection and discrimination of visual perception using electrocorticographic signals. J. Neural Eng. 15:036001. doi: 10.1088/1741-2552/aaa9f6