Abstract
When we elect representatives to the U.S. House of Representatives (or to state legislative bodies, or even the school board), we do so by dividing people into districts, and having each district elect one representative. The districts we draw as shapes on maps can affect the outcome of the elections. As a result, the process of creating or changing districts and the shapes we draw to create them are important. After every census, each state must construct a new district map. When they do that unfairly, it can give an unfair advantage to one of the political parties. This is called gerrymandering. By looking at the shapes of districts and examining their compactness, we can start to detect fair and unfair district maps.
Are Elections Fair?
Elections are frequently used to make a variety of decisions—for example, you might have voted on an activity or reward in a class or as a family. They are a common feature of governments, because they allow the voting population to express their opinions and combine those opinions to make a decision. When we choose between more than two options, or have many people voting in different ways or places, elections get complicated, and the process or the outcomes can feel unfair. What would it even mean for an election to be fair or unfair? It turns out that there are a lot of aspects we could examine, but we are going to focus on just one that mathematicians have been examining recently: when we divide people up into groups to vote, how do the shapes we make affect elections?
In the United States, the officials serving in a part of the federal government called the House of Representatives are elected by each state. More specifically, states divide themselves into districts, each of which elects one person to the House of Representatives. For example, Florida has 27 districts and Colorado has 7 districts. Since everyone gets to vote, why do the districts matter? If everyone in a state voted the same way it would not matter at all, but that is rarely true. If some of the state’s population prefers Party A and the rest prefers Party B, it would make sense for some of the state’s representatives to be from Party A and some from B, to represent the voting choices of the whole state more accurately. If a district has more voters for Party A than Party B, they will elect a Party A representative, and vice versa.
Creating Districts
Every 10 years, the U.S. Census is conducted, which counts everyone who lives in the country and notes where they are living [1]. Based on census numbers, each state is told how many Representatives they get to elect, and states draw new district maps based on their allowed number of Representatives. How should states divide people up to vote? Which shapes are fair?
To start, let us consider three different possible schemes. First, could we impose a grid on each state, like graph paper? States have weird borders and bumpy parts, but maybe using equal squares would be a good place to start. A second method could involve using the divisions that states already have—could each county (or parish or borough) be a district? Since those borders have already been agreed upon, this also seems like a reasonable place to start. Third, maybe we could try mixing people up—could every voter be assigned to a district at random, so that the districts are all distributed throughout the state? To choose between all the possible methods, we first need to understand which rules districts must follow.
Rules for District Maps
The first rule that districts need to follow is that every district must have the same number of people. This is the one rule about redistricting that comes from the U.S. Constitution. The census data is the baseline for making district maps. As a result, districts drawn on the map may appear to be very different sizes with very different areas, but that is allowed as long as the same number of people live in each district.
This means that our first idea is probably not going to work, because a grid square with a city in it has a lot more people living inside it than a grid square with farmland. It also means that, unless we are very lucky and each county has the same number of people living in it, our second idea will not work, either. We have not ruled out the third proposal, though. Could we mix people up and make sure the same number of people are assigned to each district?
Unfortunately, it is not that easy, because there are more rules put in place by the states. States disagree about some of the things we should think about when drawing districts, but they agree on what shapes of districts are allowed: every district should be contiguous and every district should be compact [1]. Contiguous is the easy one: it means that districts need to be all in one piece. This rules out our random district assignment plan! If we randomly assign people to districts, there will be gaps and pieces, and districts will not be contiguous.
Compact is where things get interesting. Take a moment and picture making something compact. Maybe you visualized crumpling up a piece of paper or smooshing together a ball of clay. Although the word “compact” was put into laws with the understanding that everyone knew what it meant, it is really not entirely clear. As politicians and lawyers have tried to clarify the term, they have come up with more than 30 different ways to measure or describe “compactness” [2]. So, now we have a question about shapes with competing ways to think about them—this is the juicy question that attracted mathematicians.
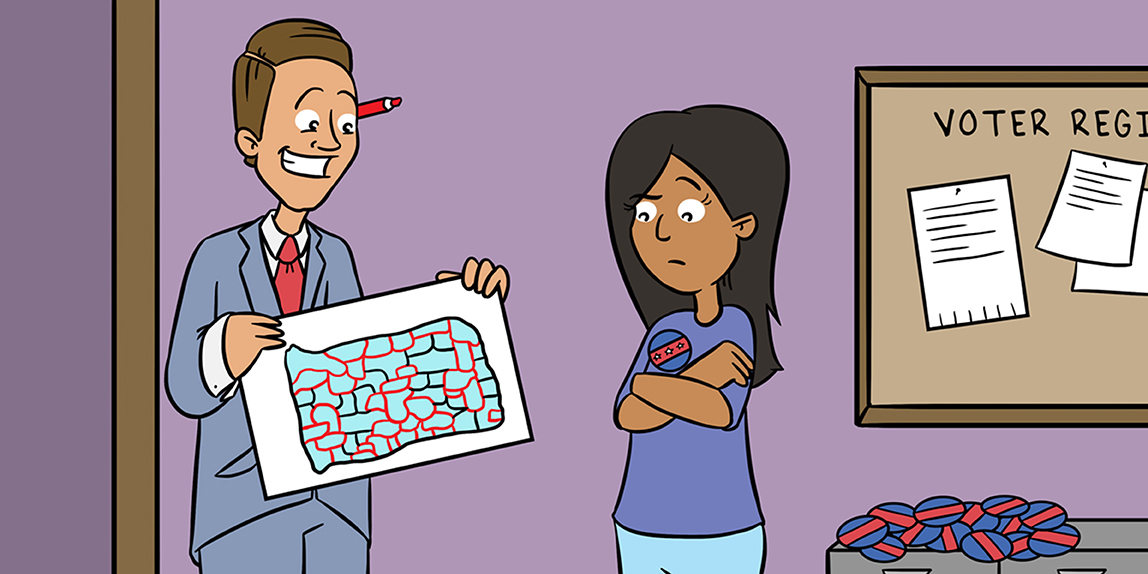
Gerrymandering
When political parties get a say in drawing district maps, they often try to draw them so they can win as many districts as possible. Drawing district maps in a way that could influence who gets elected is called gerrymandering. When people draw districts to influence the outcome of elections, the shapes of the districts can get strange. This is where the name “gerrymandering” came from—in the 1800s, a candidate named Elbridge Gerry was going to win an unfairly created district that was weird and squiggly and curled around Massachusetts Bay (Figure 1). An editorial cartoonist dubbed it Gerry’s Salamander, and it stuck [1].
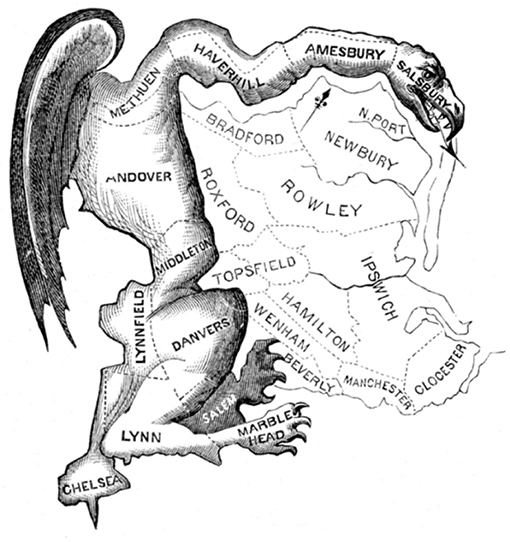
- Figure 1 - This political cartoon, drawn by Elkanah Tisdale and published in the Boston Gazette in 1812, added claws, wings, and teeth to the oddly shaped district that wrapped around the western and northern boundaries of the electoral region in Massachusetts.
- Tisdale called it “Gerry’s Salamander,” after the political candidate Elbridge Gerry, which developed into the word “gerrymandering,” which describes drawing districts for political advantage (instead of fairness).
Ever since then, political parties have tried to draw districts that favor their candidates, and the back and forth push about what district maps are fair continues. Gerrymandering was addressed in the Voting Rights act of 1965, and continues to be considered by lawmakers and the courts today—the Supreme Court decided a case about gerrymandering as recently as 2019.
Detecting Weirdly Shaped Districts
When districts are drawn with electoral goals in mind, the shapes tend to get weird. The way to detect that weirdness is to come back to the idea of compactness. Your crumpled ball of paper from earlier might be compact, but it is three dimensional. Our districts (at least on a map) are two dimensional. The closest shape to your ball of paper in two dimensions is a circle, so one way to start thinking about how compact a district is would be to think of ways to measure how close the district’s shape is to a circle.
One of the things that makes a circle unique is that it is the shape that contains the most area given a particular perimeter: if you have a piece of string and want to enclose as much stuff inside its boundary as possible, you make a circle. The area (A) of a circle can be expressed as A = πr2, where r is the radius. The perimeter (circumference) (P) of a circle can be expressed as P = 2πr. If we want to think about the relationship between the area and perimeter, we could build a ratio: , and think of it as the “score” this shape gets. But having the radius (r) show up in the result means that differently sized circles will have different scores, which is not accurate because a bigger circle is not less compact than a smaller one. To keep this from happening (and to make the units all cancel), we might square the perimeter so that there is another r in the denominator so all of them will cancel. Try . Now every circle will have the same score. But since circles are the best, most compact shape, people wanted them to score 1. That would happen if we added a 4π into the top of our score so that the “leftover” 4π would cancel: . This score is called the Polsby-Popper score [2]. A circle scores a 1, a square (with side length s) scores , and a long skinny rectangle (say, 1 unit by 100 units) scores (Figure 2).
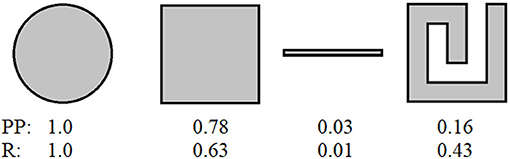
- Figure 2 - The Polsby-Popper and Reock scores for a circle, a square, a long narrow rectangle, and a square with a “spiral” cut out of it.
- You can see that the Polsby-Popper score considers the square-spiral to be more like the long narrow rectangle (it has a lot of perimeter for its area), but the Reock score of the square-spiral is more like that of the square (they will have similar circles that fit around them). We can tell that both the long narrow rectangle and the square-spiral are less compact than the square by either score, but they disagree on how much worse, and which shapes most resemble each other.
Another possible way to measure how much a shape is like a circle would be to take the district shape and find the smallest circle that would fit around it. Imagine starting with a big circle and shrinking it down until the inside shape is touching the circle in enough places that there is no wiggle room left. If the inside shape is also a circle, the shapes would match everywhere, but if it is not, there would be gaps between the inside shape and the circle. The less like a circle the shape of a district is, the more gaps there would be. We could build another ratio, , where A is the area of the district and C is the area of the circle, which is called the Reock score [3] for compactness. Using this method, a circle would score 1, a square would score , and our long skinny rectangle would score .
You can see that the scores obtained using these two methods decrease in the same order for the three shapes, which matches our intuition, but they do not decrease by the same amount, because they measure different things. Which measure of compactness is better? It depends, which is a frustrating answer. Think about one more shape: a square with a sort of squared-off spiral cut out of it. This shape has a Polsby-Popper score of , and a Reock score of . Is this a better or worse shape for a district than the others we have considered? How would the original gerrymander in Figure 1 fare under these scores?
Drawing Districts is Not Easy!
Determining the fairest shape of districts might already seem complicated—but it gets even more so! What happens when a district is along water? Part of its boundary is the coastline, which is fundamentally bumpy [4]. When you zoom in on the coastline of your map, you can see more bumps along the coastline (details that are smoothed out lower resolutions). Those bumps make the measurement of the coastline, and so the perimeter of the district, longer, often by significant amounts. The district is the same, but looking at different maps changes the measurements, and therefore the scores we calculated. We also need to think carefully about what we want to include when we consider the area of a district. For example, if there is a lake inside a district, do we count it as part of the area? If we do not count the area of the lake, do we have to count the shoreline as part of the perimeter? These are discussions that have more than one reasonable answer. A map-measurer who is consistent minimizes these problems, but it is hard to say which method is right.
Fair Elections Need Fair District Maps
Elections are an important part of how we choose our leaders, and so it is important to understand them, and to work to keep them fair. One of the places that unfairness has crept into our system is in how we divide people up into districts to choose Representatives (for the United States House), or at lower level elections, like school board or city council. When people try to gerrymander those districts, it shows up in their shapes.
The Polsby-Popper and Reock scores are just two of the many ways people have thought of to measure the compactness of voting districts. Deciding which measures are the most fair is not just a math question—it is one for us to decide as a society. Mathematics can help us clarify the questions, though. Mathematicians are also showing that one type of score can miss various kinds of compactness failures, but if we look at several different measures together, we are likely to be able to point out gerrymandering. Fair district maps are an important part of fair elections, and, by looking at compactness and using many other tools, mathematics is helping us get better at detecting unfairness.
Glossary
District: ↑ A district is a geographic region that will participate in an election together. In House elections, each district elects one Representative to the House.
Contiguous: ↑ A district (or other shape) is contiguous if it is all in one piece. You can travel between any two places in the district without leaving the district.
Compact: ↑ A district (or other shape) is compact if its parts are close together. There is argument about how to define this, but we will say compactness is being similar to a circle.
Gerrymandering: ↑ Gerrymandering is drawing district maps with the goal of giving one political group the advantage in an election, rather than drawing district maps that equitably reflect the opinions of voters.
Polsby-Popper Score: ↑ This score combines the perimeter and area of a district in the formula . A circle would score 1, and less compact shapes would have scores between 0 and 1.
Reock Score: ↑ This score compares the area of a district with the area of the smallest circle that contains it according to the formula . A circle would score 1.
Conflict of Interest
The author declares that the research was conducted in the absence of any commercial or financial relationships that could be construed as a potential conflict of interest.
References
[1] ↑ ACLU. 2010. Everything You Wanted to Know About Redistricting But Were Afraid to Ask. Voting Rights Project. Available online at: www.aclu.org/voting-rights
[2] ↑ Lunday, B. J. 2014. A metric to identify gerrymandering. Int J Soc Syst Sci. 6:285–304. doi: 10.1504/ijsss.2014.065207
[3] ↑ Young, H. P. 1988. Measuring the compactness of legislative districts. Legis Stud Q. 13:105–15.
[4] ↑ Mandelbrot, B. 1967. How Long is the coast of Britain? Statistical self-similarity and fractional dimension. Science. 156:636–8.