Abstract
Scientists use a mathematical subject called topology to study the shapes of objects. An important part of topology is counting the number of pieces and the number of holes in an object, and researchers use this information to group objects into different types. For example, a doughnut has the same number of holes and the same number of pieces as a teacup with one handle, but it is different from a ball. In studies that resemble activities like “connect-the-dots,” scientists use ideas from topology to study the “shape” of data. Ideas and methods from topology have been used to study the branching structures of veins in leaves, voting in elections, flight patterns in models of bird flocking, and more.
What is a Shape?
Shapes are so fundamental to our existence that our brains start to notice them when we are as young as 4 or 5 months old. But what exactly do we mean by “shape”? We are used to describing common shapes like lines, circles, and cubes, but what about more complicated objects, like a dragon or a Pokémon or a human being?
Topology is a branch of mathematics that concerns the shapes of things [1, 2]. To help us understand topology, let’s pretend that we have a circular rubber band. We want to describe the properties of an object that stay the same if we stretch it or shrink it or bend it, but without us gluing things together or breaking the object. From a topological viewpoint, because we can stretch the rubber band into an oval, we say that the circle and the oval are topologically equivalent. However, the rubber band is not topologically equivalent to a segment of a string, because the rubber band has a hole in the middle but the string does not. Remember that we are not allowed to glue the ends of the string together, and we are also not allowed to cut the rubber band.
By figuring out which shapes are equivalent to each other in this special way, we can separate shapes into different groups. As an example, let’s assign the letters in the word “Pokémon” to groups of topologically equivalent objects. See the short animation in Video 1. The letters “P” and “o” belong to the same group, because we can compress the bottom part of the “P” upwards and then stretch the hole into the shape of the letter “o.” Consequently, “P” and the two instances of the letter “o” make up one group of topologically equivalent letters. The “k,” “m,” and “n” form a different group, because we can turn each of them into a dot by squeezing and bending them. The remaining letter, “é,” is an interesting one. Without its accent, we would be able to shrink the round tail of the “e” into the left side of the semicircle at the top of the letter. We could then stretch that semicircle into the shape of the letter “o,” which places it into the same group as “P” and “o.” However, with the accent, “é” has two separate pieces that we are not allowed to glue together, so it belongs to its own group.
Shapes that are in the same group have important features in common. Although the details of the shapes “P” and “o” differ, they both have one hole that we cannot remove. By contrast, the letters “k,” “m,” and “n” do not have any holes. If we look at the uppercase letter “B,” we see that it does not belong in either of these groups. It is, however, topologically equivalent to the number “8,” because both the “B” and the “8” have two holes. The number of pieces in an object is also important, so the “é” (with one hole and two pieces) belongs in a different group from all of the other letters that we have discussed. Try separating the letters in your name into groups of topologically equivalent letters.
Now let’s make things even more interesting by looking at some Pokémon themselves. For each Pokémon in Figure 1, count the numbers of pieces and holes. Are you able to group any of them together based on this information?
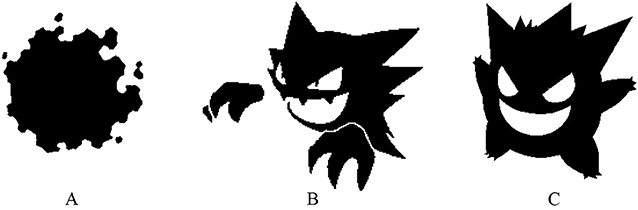
- Figure 1 - Pokémon have different shapes, as we can see with (A) Gastly, (B) Haunter, and (C) Gengar.
- Can you categorize Pokémon of different shapes based on their numbers of holes and numbers of pieces?
It can be challenging to study the topology of solid objects like those that we have been discussing so far, but now think about drawing pictures in activities like connect-the-dots. We have a bunch of dots, and we often see enough of them that we have a good idea of what shape we will get when we connect them (see Figure 2). People are good at determining shapes from just these dots, but is there a way to do this automatically? Even though this type of activity is typically harder for a computer than for a human, mathematicians and other scientists seek good ways to do it automatically because we want to look at many different collections of dots.
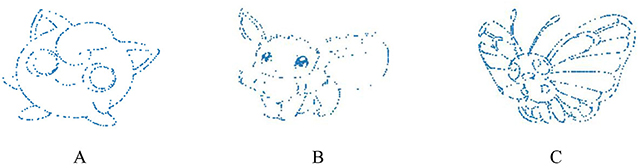
- Figure 2 - Can you imagine what the Pokémon in this figure will look like when you connect the dots?
- The Pokémon that we show are (A) Jigglypuff, (B) Eevee, and (C) Butterfree.
Topology can help us make sense of large amounts of data, and we can think of exploring the topology of a collection of data (called a data set) as a giant game of connect-the-dots. In real life, there are many different kinds of data and the data may not come in the form of dots on a page. However, we will focus on data that also have associated numbers, such as the populations and other features of regions on a map, the heights of children in a school, or the number of words in each paragraph of this article. We can analyze data of this type in a way that is similar to how we thought about dots on a page.
Discovering the Shape of Data
People think about topology and data together in an area of study called topological data analysis (TDA) [3, 4, 5]. In TDA, we try to describe the shape of a data set by first building a series of pictures. By connecting the “dots” in a data set in various ways, we can study the structure of the data. Instead of connecting the dots by drawing lines from one dot to another like we are used to doing, we connect the dots by increasing their size. As we make the dots larger, the gaps between the dots become smaller, and eventually the dots overlap (see Figure 3).
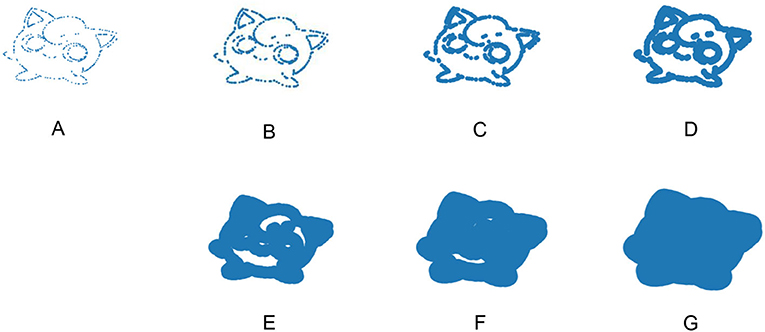
- Figure 3 - In (A–G), we draw Jigglypuff using increasingly large dots.
- When the dots are small, they do not touch each other, so there are many pieces and no holes. As the dots become larger, some of them touch each other, so the number of pieces decreases and some holes develop. At first, Jigglypuff becomes easier to see as the dots get larger, but then Jigglypuff becomes harder to see. In Table 1, we indicate the number of pieces and number of holes in each picture in this figure.
It is important to figure out how large to make the dots. What if we make the dots really huge, as in Figure 3G? We then have one very large object with no holes. In this example, Jigglypuff becomes very hard to discern when the dots are very large. Importantly, we may notice interesting things for different dot sizes. By using mathematics and computation, we can consider many different sizes of dots, and we obtain an object for each one. Each of the seven versions of Jigglypuff in Figure 3 has a different number of pieces and number of holes, and we can count them (see Table 1).
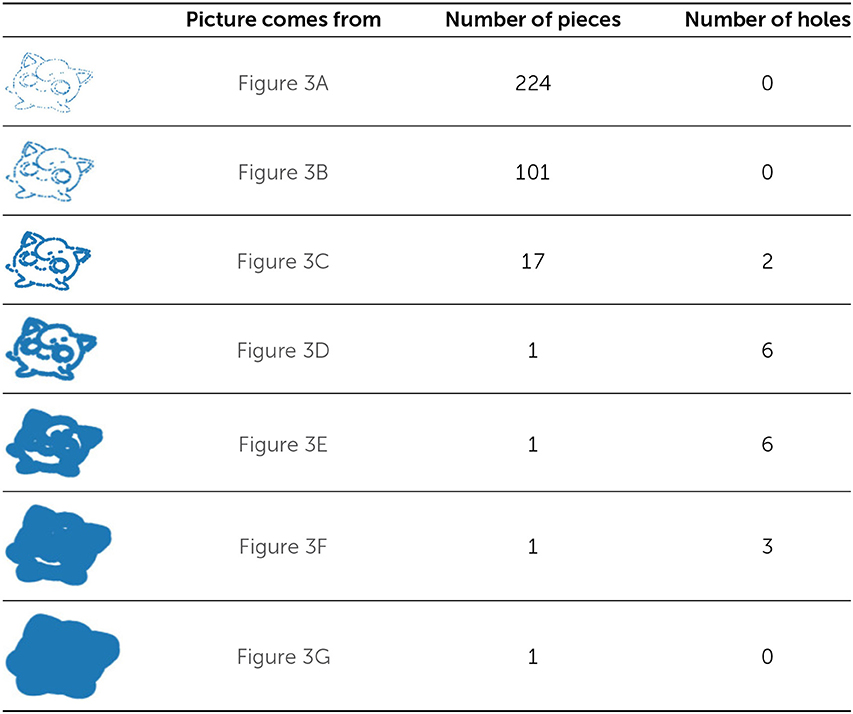
- Table 1 - We can describe the seven pictures of Jigglypuff in Figure 3 with the following pairs of numbers: (224, 0), (101, 0), (17, 2), (1, 6), (1, 6), (1, 3), and (1, 0).
- In each pair of numbers, the first value indicates the number of pieces and the second value indicates the number of holes.
The information in Table 1 is one way of describing and summarizing what we observe from studying this range of dot sizes. That is, we are studying the structure of Jigglypuff across many sizes (i.e., scales). Each version of Jigglypuff in Figure 3 is at one scale, and by counting the number of pieces and number of holes at each scale, we can explore the range of dot sizes over which Jigglypuff’s features persist. This is a common approach in TDA: we look at the dot sizes over which different features persist in data that we want to study.
What Can We Learn From Topological Data Analysis?
TDA can tell us a lot about many things in the world. It allows us to explore complex data in a huge variety of topics in social science, biology, astronomy, and more [3].
We can use TDA to help us understand the universe. Planets like Earth are part of solar systems, which in turn are part of galaxies, which occur in clusters. If we look into a telescope and zoom in on a solar system, the planets seem to be very far apart. But if we zoom out to look at an entire galaxy, each solar system may appear as just a dot and structures within the solar system seem to merge together. If we zoom out further, each galaxy may appear as just a dot. To study the structure of the universe at these different scales, scientists have used TDA to count the numbers of pieces and holes in a data set of star positions [6].
Moving back down to earth, scientists have used TDA to examine the patterns of veins in leaves [7]. They studied the structure of more than 100 leaves and found different patterns—kind of like human fingerprints—in the leaves. These fingerprints can help improve the ability of scientists to identify leaves from small leaf fragments, and they may also be helpful for improving our understanding of how leaves grow. TDA is also useful for studying the structure of fungi, blood vessels, and other things with branches and loops.
People also use TDA to describe activity patterns of people and animals. For example, two of us recently studied geographic voting patterns in different areas of California [8]. We used TDA to detect areas of the state where people voted differently from those in neighboring areas in the 2016 presidential election. Animals other than people also produce interesting patterns. Schools of fish and flocks of birds include many individuals and can form beautiful structures. TDA can help scientists explore and understand these complex patterns [9].
In summary, TDA is an increasingly popular approach for studying many problems, which range from connecting the dots in pictures of Pokémon to the structure of the universe [6], patterns in nature [7], geographic voting patterns in elections [8], and much more. TDA is a fascinating and important area of mathematics that helps people makes sense of complex data [3, 4, 5].
Glossary
Topology: ↑ A branch of mathematics that people use to study the shapes of objects.
Topologically Equivalent: ↑ A term that describes two objects that can be turned into each other by stretching, shrinking, bending, or warping them (but not gluing or tearing them).
Video 1: ↑ Transformation of the letters in the word “Pokémon” to assign them to groups of similar letters. Each of the groups consists of topologically equivalent letters.
Data: ↑ Characteristics and information, typically in the form of quantitative facts and other quantitative features, that are collected through observations or in some other way.
Data Set: ↑ A collection of data. A data set is often in a form that one can study using a computer.
Topological Data Analysis: ↑ A family of techniques for studying the “shape” of data by using topology.
Scale: ↑ A characteristic size of an object, such as the radius of a disc or the length of a side of a square.
Conflict of Interest
The authors declare that the research was conducted in the absence of any commercial or financial relationships that could be construed as a potential conflict of interest.
Acknowledgments
We are grateful to our young readers — Charlotte Amann-Sulzmann, Simon Cafiero, Addison Cart, Nia Chiou, Valerie K. Eng, Linnea Keiser-Clark, Coralea Lash-St. John, Adele Low, Maple Leung, Nora Stricker, Kate Van Hooser, and one anonymous person — for their many helpful comments. We also thank their parents, teachers, and friends — Clayton Cafiero, Lyndie Chiou, Puck Rombach, and Steve Van Hooser – for putting us in touch with them and soliciting their feedback. We also thank Norman Redington, our editors, and our reviewers for helpful comments. MAP, MF, and YHK acknowledge support from the National Science Foundation (grant number 1922952) through the Algorithms for Threat Detection (ATD) program. CMT acknowledges support from the National Science Foundation (grant number 1813752) through the Division of Mathematical Sciences.
References
[1] ↑ Ghrist, R. W. 2014. Elementary Applied Topology. Seattle, WA: Createspace. Available online at: https://www.math.upenn.edu/~ghrist/notes.html
[2] ↑ Stolz, B. J., and Mahler, B. I., 2015. ‘H’ is for homology. Available online at: https://www.maths.ox.ac.uk/about-us/life-oxford-mathematics/oxford-mathematics-alphabet/h-homology
[3] ↑ Otter, N., Porterm M. A., Tillmann, U., Grindrod, P., and Harrington, H. A. 2017. A roadmap for the computation of persistent homology. EPJ Data Sci. 6:17. doi: 10.1140/epjds/s13688-017-0109-5
[4] ↑ SIAM News. 2020. January/February 2020 issue. SIAM. 53. Available online at: https://sinews.siam.org/Current-Issue/Issue-Archives/Issue-Archives-ListView/PID/2282/mcat/2279/evl/0/TagID/302?TagName=Volume-53-|-Number-1-|-January%2FFebruary-2020
[5] ↑ Topaz, C. M. 2016. Topological data analysis: One applied mathematician’s heartwarming story of struggle, triumph, and (ultimately) more struggle. DSWeb: The Dynamical Systems Web. Available online at: https://dsweb.siam.org/The-Magazine/Article/topological-data-analysis
[6] ↑ Cisewski-Kehe, J., Wu, M., Fasy, B., Hellwing, W., Lovell, M., Rinaldo, A., et al. 2018. “Investigating the cosmic web with topological data analysis,” in American Astronomical Society Meeting Abstracts #231. Washington, DC. Available online at: https://ui.adsabs.harvard.edu/abs/2018AAS...23121307C/abstract
[7] ↑ Ronellenfitsch, H., Lasser, J., Daly, D. C., and Katifori, E. 2015. Topological phenotypes constitute a new dimension in the phenotypic space of leaf venation networks. PLoS Comput. Biol. 11:e1004680. doi: 10.1371/journal.pcbi.1004680
[8] ↑ Feng, M., and Porter, M. A. 2021. Persistent homology of geospatial data: A case study with voting. SIAM Rev. 63:67–99. doi: 10.1137/19M1241519
[9] ↑ Topaz, C. M., Zeigelmeier, L., and Halverson, T. 2015. Topological data analysis of biological aggregation models. PLoS ONE 10:e0126383. doi: 10.1371/journal.pone.0126383