
Abstract
For decades, scientists have known where the highest numbers of species that live aboveground are found. So, they made maps of the world showing these patterns. For most of the aboveground groups, the highest numbers of species occur in the tropics and numbers decrease toward the poles. However, until recently, we did not understand such global patterns for many organisms living in the soil. We decided to create global maps of earthworm species richness. Earthworms provide humans with many useful services, such as moving the soils and improving their quality, which can increase the amount of food that is grown. If we want to protect earthworms and the services they provide, these global maps of earthworms are important because we need to understand where they are and why they live there.
Mapping the World’s Animals
There is around 150 million km2 of land on earth. That is an area so huge that it is hard to imagine. With so much land, how do we know where the animals are, and how many there are? Why would we even want to know about the numbers of animals and their patterns across the world? Well, for example, we may want to know where to create nature reserves to protect the most species. Or maybe we are simply interested in knowing what the general pattern of animal and plant populations are, and whether that pattern is consistent across lots of different species. For example, tropical forests are known for having many different species of birds, but is that true for other animals?
To learn about the numbers of animals, people (both scientists and non-scientists) usually do surveys. A survey is simply counting the number of species (or number of individuals present) using a suitable technique for that species. For example, if we want to survey butterflies, we use a hand-held net and try to capture as many butterflies as possible using consistent methods, surveying a certain area of land for a given amount of time. However, doing surveys takes time, and it can also cost a lot of money. Additionally, we will never be able to do a survey at every location in the entire world. So, how do we know how many animals there are across the world?
We can use math! Specifically, we can use something scientists call statistical models, or just models for simplicity. For many decades, scientists have been creating models to estimate how many species of birds, plants, and other aboveground species there are across the globe. Unfortunately, this method has never been used for many of the organisms beneath our feet. So, we decided to create a model for earthworms. Earthworms are particularly cool (Figure 1). These soil organisms provide humans with many ecosystem services [1]. They help break down the fallen leaves so that the nutrients go back into the soil, they help make our crops grow better, and they help keep our climate the way we need it. Also, for a soil organism, earthworms are quite easy to survey because we can see them! Besides, there is quite a lot of information available about earthworms.
![Figure 1 - There are 7,000 described species of earthworms across the globe [1], and they vary considerably in their appearance.](https://www.frontiersin.org/files/Articles/547660/frym-09-547660-HTML/image_m/figure-1.jpg)
- Figure 1 - There are 7,000 described species of earthworms across the globe [1], and they vary considerably in their appearance.
- (a) Scherotheca gigas is an earthworm often found in France and Spain (photograph taken by Iñigo Virto). (b) Aporrectodea smaragdina is found in the Alps and eastern Europe (photograph taken by Michael Steinwandter).
What Did We Do to Understand Global Patterns of Earthworms?
To create a model to estimate the number of earthworms across the world [2], we needed data specifically about earthworms. Earthworm data consists of the numbers of earthworm species, collected using surveys. One person cannot survey everywhere, but we wanted to get as many surveys from across the globe as possible. So, we asked lots of other scientists to send us data from their surveys. These people were earthworm scientists that we knew, or who had already published the results of their surveys in scientific journals. We were confident that the data were trustworthy, especially the data that had already been analyzed and published. When scientists publish papers, their data are always checked and critiqued by other scientists. The surveys were often done using slightly different methods, but many scientists simply dug a square hole in the ground, searched the soil for earthworms, and counted the numbers of earthworm species they removed. In total, we gathered data from 180 researchers across the globe, containing just over 9,000 surveys of earthworms.
The number of earthworm species scientists counted in their surveys ranged from no species in several surveys to 12 species found in another. We also needed information about the climate (for example, the temperature and rainfall) and the soil (such as the pH) at the location of each survey. We got this type of information from freely available databases.
Models ultimately use a certain factor (such as climate, soil pH) to estimate the number of earthworm species in an area. To understand how models work, imagine this: we survey lots of beaches and ask ice cream sellers how many ice cream cones they have sold. We then get information on the average temperature at each beach. We could then create a model showing how temperature affects the number of ice cream cones sold at each beach. As you might expect, the hotter the temperature, the more ice cream cones are sold. Using this model, we could then estimate how many ice creams will be sold at any temperature, which gives us an idea about ice cream cone sales on beaches where we cannot survey. We can do something similar for earthworms to see how the numbers of species found in a survey changes with an environmental factor like temperature.
Our earthworm model contains many details about the environment−12 different aspects in total—but the basic principle remains the same. The 12 environmental details included information about the soil, the type of vegetation covering the ground, and the climate. Using our model, we then estimated how many species of earthworms there are for all points in the world, and we made a map of that (Figure 2).
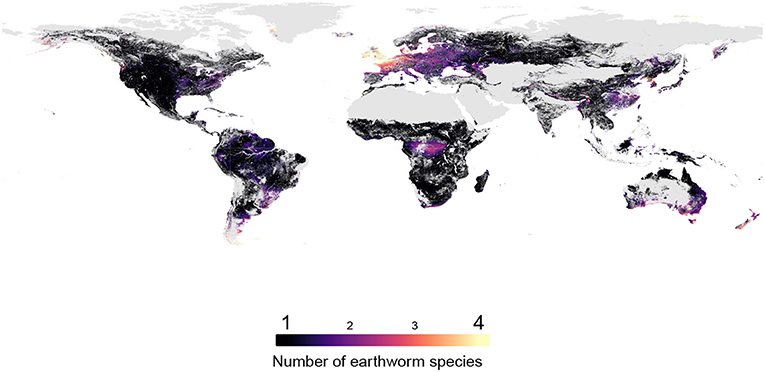
- Figure 2 - The number of earthworm species across the world, created using our model.
- In total, 180 researchers provided data from just over 9,000 surveys. This survey data was combined with data about the environment, such as pH, so that we could predict the number of earthworm species across all areas of the world—even where no surveys have been done. Typically, the number of earthworm species in any one place varied between 1 (areas in dark purple) and 4 (areas in bright yellow), but areas in the temperate region, such as Europe, had the highest number of earthworm species (shown in the yellow shades).
What We Found Out About Earthworms
As we mentioned at the beginning of this article, we usually expect the tropics to have the highest numbers of species. This is because, typically, we find more species in places that have higher temperatures. What our maps show is that this is not the case for earthworms. Our model indicates that, if you were to do a survey in a tropical region and one in a temperate region, you would find more earthworm species in the temperate region.
Why might this be? There are many aspects of the environment that shape the number of earthworm species found in a survey. And although the soil is important, we found that climate (for example, temperature and amount of rain) was the most important factor determining the number of species. As earthworms prefer to live in moist, warm conditions, the temperate region is much more suitable for them. There are more earthworm species where the environmental conditions are ideal. As long as the environment is not too extreme—too dry, too wet, too hot, too cold—it is very likely that there will be earthworms. Some species of earthworms may like conditions that are slightly different from most other earthworms. Alternatively, some species of earthworms may tolerate living in regions that are less than ideal, because there are fewer species to compete with for food, for instance, but this is an area scientist are still studying.
Earthworm Models Can Broaden Conservation Efforts
Earthworms are really important for many ecosystem services that humans need, such as increasing food production. With the new knowledge gained from our model, we hope that earthworms will now be considered when scientists and conservationists think about creating nature reserves. Typically, nature reserves are established based on the number of species of plants or other aboveground organisms. But, since high numbers of earthworm species do not exist in the tropics (unlike many aboveground plants and animals), we need to think about earthworms and other soil organisms separately, and potentially establish nature reserves just for them.
Also, as we found that climate is the main aspect of the environment correlated with the numbers of earthworms, the fact that our climate is changing is concerning. Our future research will establish how the numbers of earthworms change as the climate changes, since some species may respond positively to changes in climate, whereas others may not. We need to understand how climate change will affect earthworms and other soil organisms, so that we can prepare to protect these valuable organisms for the future.
Glossary
Nature Reserves: ↑ Areas where the animals, plants, and the environment are protected.
Survey: ↑ Counting the number of species (or number of individuals present) using a suitable technique for that species.
Statistical Models: ↑ The process of trying to use known factors (such as temperature) to predict a factor that we may not be able to measure (such as the number of earthworm species).
Ecosystem Services: ↑ Benefits to humans provided by the natural environment and the organisms in it. Ecosystem services can include increasing food production, breaking down fallen leaves, and helping to keep our climate the way we need it.
pH: ↑ The scale used to specify how acidic (lemon juice is acidic) or how alkali (baking soda is alkali) something is.
Temperate Region: ↑ The earth’s middle latitudes, which span between the tropics and the polar regions. The temperate region typically has more distinct seasons (spring, summer, autumn, and winter) compared to tropical climates.
Conflict of Interest
The authors declare that the research was conducted in the absence of any commercial or financial relationships that could be construed as a potential conflict of interest.
Original Source Article
↑Phillips, H. R. P., Guerra, C. A., Bartz, M. L. C., Briones, M. J. I., Brown, G., Crowther, T. W., et al. 2019. Global distribution of earthworm diversity. Science 366:480–5. doi: 10.1101/587394
References
[1] ↑ Orgiazzi, A., Bardgett, R. D., Barrios, E., Behan-Pelletier, V., Briones, M. J. I., Chotte, J. L., et al. 2016. Global Soil Biodiversity Atlas. Luxembourg: Publications Office of the European Union. doi: 10.2788/2613
[2] ↑ Phillips, H. R. P., Guerra, C. A., Bartz, M. L. C., Briones, M. J. I., Brown, G., Crowther, T. W., et al. 2019. Global distribution of earthworm diversity. Science 366:480–5. doi: 10.1101/587394