Abstract
Did you know that we have better maps of the moon, Mars, and Venus than we do of the seafloor on Earth? Since oceans cover 71% of the Earth’s surface, understanding what the seafloor looks like, and where different processes, such as ocean currents are active, is hugely important. Mapping the seafloor helps us to work out things like where different types of fish live, where we might find resources, such as rare metals and fossil fuels, and whether there is a risk of underwater landslides happening that might cause a tsunami. Mapping the seafloor is very challenging, because we cannot use the same techniques that we would use on land. To map the deep ocean, we use a tool called a multibeam echo-sounder, which is attached to a ship or a submarine vessel.
Why Do We Need to Map the Seafloor?
Over 96.5% of the Earth’s water is found in the oceans, while the remaining 3.5% is found in lakes and rivers [1]. In this article, we are going to talk about how we map the seafloor of the oceans, but the same technology is also used on a slightly smaller scale in lakes and rivers, to map the land under these bodies of water.
But why do we need maps of the seafloor? The most obvious answer is to help ships find their way around. Although most vessels travel along at the sea surface, they need to be aware of hazards under the water, like rocks and shallow banks where they might run aground. For vessels that travel under the water, like submarines, it is even more important to have accurate maps, so they can navigate and avoid hazards. It is also important to know where these hazards are when we plan to build offshore structures, such as piers and wind turbines, so that we know they will be built on suitable foundations. Seafloor maps help us understand processes, such as ocean currents. Ocean currents are huge conveyor belts of fast-moving water, driven by differences in ocean temperature and salinity (saltiness) [2]. The strongest current system is called the Antarctic Circumpolar Current, which is the only current to link all the major oceans as it flows all the way around the world [2]. Features under the water, such as submarine volcanoes and canyons, can influence where these currents flow. So, if we know where these underwater features are, we can more accurately predict where the currents will go and how they will behave. Ocean currents are also very important because they help control our weather and climate. Maps of the seafloor are also useful tools for answering a wide range of other scientific questions, such as finding out where certain types of fish like to live, how new volcanoes can form at the bottom of the ocean, and where we might find natural resources, such as oil and gas.
How Do We Map the Seafloor?
On land, we can map the landscape quickly and efficiently using satellite-based technology. This technology works by sending a signal from a satellite that is orbiting the Earth, which then bounces off the Earth’s surface and returns to the satellite. Satellites use various types of signals for mapping the landscape, but basically all the signals are some form of light. The length of time it takes for the signal to return to the satellite tells the satellite how far away the Earth is, and the satellite can then use that data to map out the features of the landscape. While some satellite-based technology that we use to map the land surface can be used in shallow water, these technologies do not work once for the deeper parts of the ocean, because the water stops the signals from reaching the seafloor. This is why we have such good maps of the moon, Mars and Venus—they do not have oceans, so we can use satellite technology to map them in great detail.
Early seafarers measured water depths using a lead-line. This was a very simple tool, made up of a heavy weight covered in something sticky (usually grease) on the end of a rope. The weight was lowered over the side of the ship until it hit the bottom and then it was pulled back up. The seafarers could tell the weight had hit the seafloor because some sediment would be stuck to the grease, and then they could measure the length of rope that was lowered down, in order to figure out the water’s depth. The position where the measurement was taken then had to be calculated using compass bearings and other instruments, such as a sextant. This was not a very accurate method and took a very long time.
During World War II, new technology was developed that allowed ships to accurately measure water depths as they sailed across the oceans [3]. These were single beam echo-sounders, instruments that could be attached to the hulls of ships. An echo-sounder works by sending out a sound signal, or “ping,” into the water. This sound travels through the water until it reaches the seafloor. When it reaches the seafloor, it bounces off and reflects back up to the ship, where the echo-sounder records the reflected signal. So, the name “echo-sounder” actually tells you how it works—it sends out a “sound” (sounder) and listens for the reflected sound, or “echo.” This is basically the same thing that happens when you stand in a big empty room and make a noise—the sound bounces off the walls because they are a hard surface, and you hear the echo of the noise that gets reflected back toward you. The time it takes for the signal to reach the seafloor and return to the ship can be used to calculate the water depth. This is done by halving the time between when the sound was generated and when the reflected sound returned and multiplying that time by the speed of sound in water (usually around 1,500 meters per second). Most ships, including small fishing boats, have an echo-sounder on board.
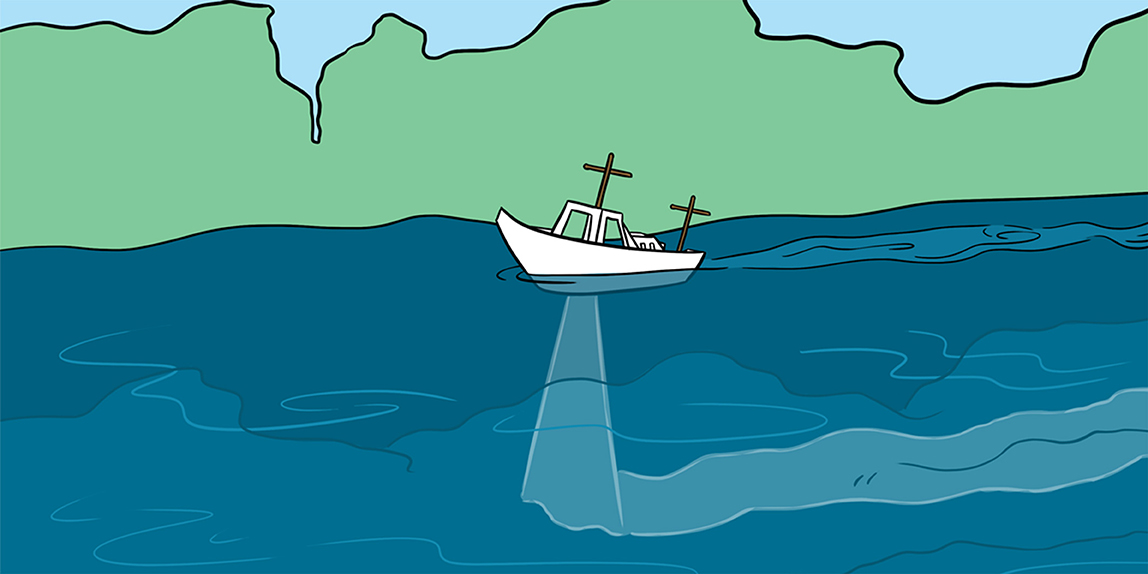
Single beam echo-sounders were a huge improvement in seafloor mapping, but they only allow us to map a line of points across the seafloor. These points can then be used to make basic maps of the seafloor, but there might be big rocks or holes in between the mapped lines that we would not see. In 1964, a company called SeaBeam developed a new technology called multibeam echo-sounders [4]. This system allows the echo-sounder to send out a “fan” of pings (called a swath) into the water, which allows us to accurately map a wide strip of the seafloor as the ship travels along (Figure 1). We can change the frequency of the sound that is emitted by the echo-sounder; in order to look for certain features in the water. For example, we can identify smaller targets, such as schools of fish and areas where gas is seeping out of the seafloor to form plumes of bubbles, or flares (Figure 2).
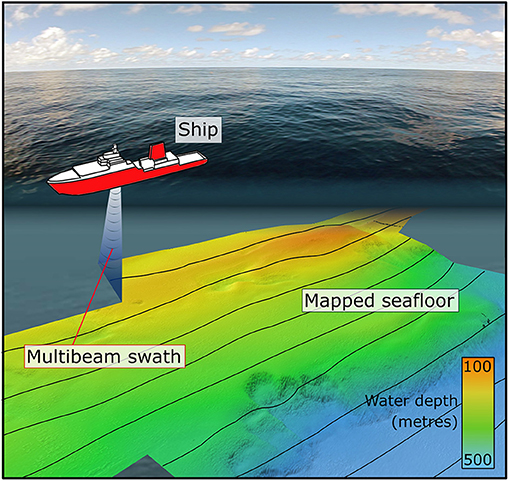
- Figure 1 - Ship mapping the seafloor using a multibeam echo-sounder.
- The echo-sounder works by sending a sound signal into the water. The sound waves travel down through the water column until they hit the seafloor where they are reflected back up to the echo-sounder. By recording the time it takes for the sound to travel down to the seafloor and back again, we can calculate the depth of the water as we know how fast the sound travels.
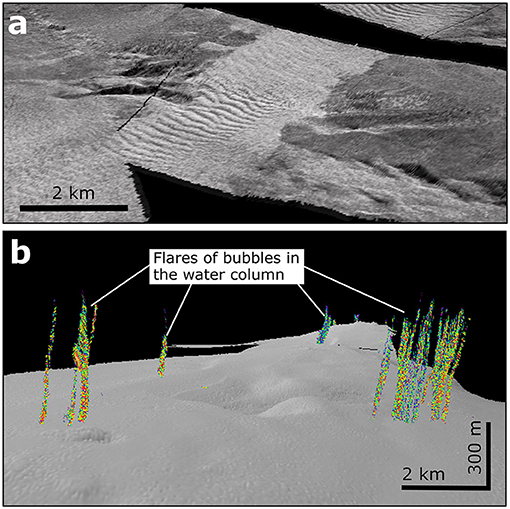
- Figure 2 - As well as mapping the water depth, echo-sounders can give us other information about what the seafloor is like, and what is happening in the water above the seafloor.
- (a) Here we can see an example of backscatter data from a multibeam echo-sounder showing ripples in a channel on the seafloor. Backscatter data records how much of the sound waves that the echo-sounder sends out get reflected back again. The light colors correspond to hard surfaces which reflect a lot of the sound, like gravel and sand, while the dark colors correspond to soft surfaces, like mud, which absorbs some of the sound waves. (b) Echo-sounders can also show us what is in the water above the seafloor, such as these flares of bubbles that have been imaged in 3D using echo-sounder data.
Underwater Discoveries and Records
Mount Everest is the highest mountain on Earth, reaching 8,848 m. This is technically true, as it is the highest mountain when you start measuring from sea level. However, if you start measuring from the seafloor, there are some much higher mountains on earth. The highest of these is Mauna Loa in Hawai’i, which reaches ~9,170 m above the seafloor. Only 4,170 m of this is exposed above the sea surface. The average depth of the world’s oceans is 3,682 m, with the deepest areas found in oceanic trenches. The deepest of these is the Marianas Trench, which reaches 10,994 m below the sea surface. You could submerge Mount Everest in the trench and still have space for Mount Washington or Tongariro as well. You could also fit 13 buildings the height of the Burj al Khalifa, the tallest building in the world, in the trench, stacked end to end (Figure 3).
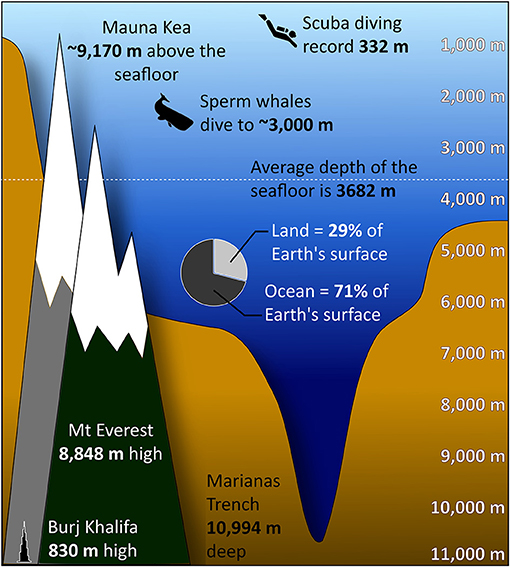
- Figure 3 - Did you know that you could hide Mount Everest underwater?
- And that there are even higher mountains if you measure them from the seafloor? To explore the deepest parts of the ocean we have to use technology, such as submersible vehicles. Even the deepest scuba divers have only reached 332 m beneath the sea surface. Sperm whales can go much deeper than this, reaching around 3,000 m. But we can use echo-sounders to map all of this without even leaving the ship!
Surprisingly, you can also find some of the hottest places on earth at the seafloor. Black smokers are vents found above submarine volcanoes, where very hot fluids generated in the Earth’s crust reach the seafloor. These can reach temperatures of 400°C and are home to incredibly unique animals, such as clams and tube worms that are not found anywhere else in the world [5]. Many of these interesting underwater features have only been identified and studied in the last few decades, because we did not have the technology available to find them before this.
New improvements to echo-sounder technology mean that multibeam echo-sounders can also be used to find shipwrecks on the seafloor [3]. This technology allows us to image the seafloor in such high resolution that we can actually produce images that show the outline of a shipwreck, down to the small details like the mast.
What Do We Need to Do Next?
Although there have been huge improvements in the maps we have of the seafloor, there are still vast areas of the ocean for which we have hardly any data. In 2018, a group of research organizations, universities, and companies launched a project called Oceans 2030 [1]. The aim of this project is to map all of the oceans to a reasonable level of detail by 2030. This is a huge project that will need a lot of work, but with all these new areas to explore, who knows what we might find! The seafloor is constantly changing as sediment is moved around by the currents and as earthquakes and faults shift the seafloor and volcanic eruptions occur. It is impossible to constantly map these changes, but we do try to return to key locations after big events like earthquakes to see what has changed on the seafloor. Mapping all of the ocean floor might seem like a huge task, but in just the last few decades we have made some massive changes in the technology that we use. This means we can get much more accurate maps, and we can do this relatively quickly. But there are still big areas to explore, who knows what we might find?
Glossary
Map: ↑ A representation, usually on a flat surface, of the whole or a part of an area
Echo-Sounder: ↑ An instrument for determining the depth of water below the surface using sound waves
Conflict of Interest Statement
The author declares that the research was conducted in the absence of any commercial or financial relationships that could be construed as a potential conflict of interest.
References
[1] ↑ Mayer, L., Jakobsson, M., Allen, G., Dorschel, B., Falconer, R., Ferrini, V., et al. 2018. The Nippon Foundation—GEBCO Seabed 2030 Project: the quest to see the world’s oceans completely mapped by 2030. Geosciences 8:63. doi: 10.3390/geosciences8020063
[2] ↑ National Oceanic and Atmospheric Administration. 2011. Ocean Currents. Available online at: https://www.noaa.gov/resource-collections/ocean-currents
[3] ↑ Dierssen, H. M., and Theberge, A. E. 2014. “Bathymetry: history seafloor mapping,” in Encyclopedia of Natural Resources: Volume II–Water and Air, ed Y. Wang (Didcot: Taylor & Francis Group), 644–8. Available online at: https://colors.uconn.edu/wp-content/uploads/sites/1423/2015/09/Dierssen_2014_ENRHistory.pdf
[4] ↑ L-3 Communications SeaBeam Instruments. 2000. Multibeam Sonar Theory of Operation. East Walpole. Available online at: https://www3.mbari.org/data/mbsystem/sonarfunction/SeaBeamMultibeamTheoryOperation.pdf
[5] ↑ National Oceanic and Atmospheric Administration. 2018. What is a Hydrothermal Vent? Available online at: https://oceanservice.noaa.gov/facts/vents.html