
Abstract
Maths is a crucial part of medicine. All the graphs, equations, statistics, and general maths we learn at school help us to understand important aspects of human and veterinary medicine, biology, and science in general. People always think that biology and chemistry are important for doctors, nurses, midwives, scientists, and all the other people involved in medicine and healthcare-related jobs, but in fact maths is also vital. So, whether you are thinking of becoming a doctor, hoping to invent medical technologies, or just wishing to understand treatments you get as a patient, understanding the maths behind medicine is crucial. This article explores how we check whether someone has a disease such as coronavirus or heart disease, how we predict and measure how many people will be affected by various diseases, and how maths is used to treat patients and prevent the spread of contagious diseases. While people are generally aware that sciences like biology and chemistry are important for jobs in the medical field, many may not realize that maths is also vital for most of these jobs. This article looks at some of the ways we use maths in medicine. If you want to become a doctor, veterinary surgeon, nurse, midwife, medical scientist, or to have any job related to healing people and animals, or even if you just want to be an informed patient, knowledge of maths is quite important!
Maths to Investigate Disease Distribution and Spread
Epidemiologists are medical professionals who practice epidemiology, which is the study of the distribution, spread, and prevention of diseases and disorders such as coronavirus, polio, asthma, heart disease, and cancer.
To understand how serious an infectious disease is, epidemiologists must know the level of infection that is present. The incidence rate is the number of new disease cases within a population in a certain time period (yearly, monthly, weekly, or daily). In addition to the number of new cases, it is vital to know how the disease has already spread. The prevalence shows the proportion of a population that has the disease at any one time, so we can help the right people in the right areas. For example, if 500 people in a town of 1,000 people (50%) have coronavirus, this is much more serious than if there are 500 cases in a city of 20,000 inhabitants (2.5%), despite the number of infected people being the same.
You may have heard about a number called R0 (pronounced “R naught”) recently. R0 is also called the basic reproduction rate of an infectious organism (like measles or coronavirus) and it means the average number of cases that are caused by one current case (Figures 1A–C). R0 allows epidemiologists to understand how a disease transfers from one person to another. An R0 lower than 1 means an infected person will infect <1 other person, on average, while if R0 is >1, the disease will spread far more rapidly. An R0 of 3 may not sound bad, but if 1 infected person infects 3 others, who also infect 3 others, this quickly results in 27 infected people (Figure 1D). This is called exponential growth, and the numbers of new cases will increase faster and faster, unless we reduce R0 and stop the disease from spreading (Figure 1E). You can read more about this in Disease Detectives: Using Mathematics to Forecast the Spread of Infectious Diseases [1]. R0 is affected by population density, how many people are vulnerable, how much contact people have with each other, and how infectious the disease is.
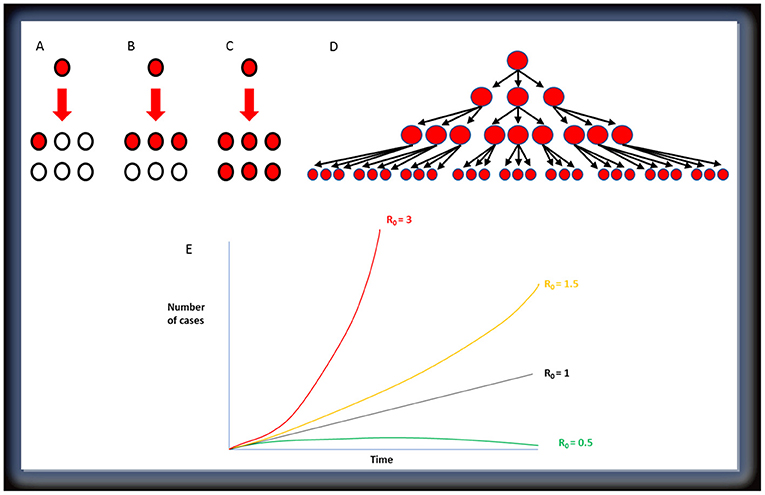
- Figure 1 - The R0 value represents how many people will likely be infected from one infected person.
- Infected people are shown in red and non-infected in white. (A) When R0 = 1, 1 person infects 1 other. (B) When R0 = 3, 1 person infects 3 others. (C) When R0 = 6, 1 person infects 6 others. (D) Spread of a disease with an R0 of 3. (E) Even when there are small increases in R0, the number of cases rises much faster.
Maths for Diagnosing Medical Conditions and Diseases
Before we can calculate R0, we must identify how many people are actually affected by a disease or condition. Maths helps ensure that medical problems are correctly identified and diagnosed. Testing for a disease like heart disease or diabetes is called diagnostic testing, and it involves measuring the amounts certain substances in blood samples or other types of samples. When testing samples, we can get a range of results:
• True positives: positive test with disease present
• False positives: positive test even though disease is not present
• True negatives: negative test without disease present
• False negatives: negative test even though disease is present
Diagnostic accuracy is the measure of how good a diagnostic test is at telling the difference between healthy and diseased patients. It is calculated using this equation:
Diagnostic accuracy does not show the full picture, so measurements of sensitivity and specificity are also needed [2]. The sensitivity of a diagnostic test is its ability to correctly identify true positives, and the specificity of a diagnostic test is its ability to correctly identify true negatives:
A negative result in a test with 100% sensitivity means the patient definitely does not have the disease. However, a positive result in a test with high sensitivity does not mean disease is present. This is where specificity is useful. A positive result in a test with high specificity is good for confirming disease. Ideally, diagnostic tests are both highly sensitive and specific, however sometimes we cannot get both.
In addition to being accurate, it is desirable for diagnostic tests to have high precision. Precision refers to the ability of a test to produce reliable results each time it is used. Precision is calculated using the following equation:
These concepts are illustrated using archery as an example in Figure 2.
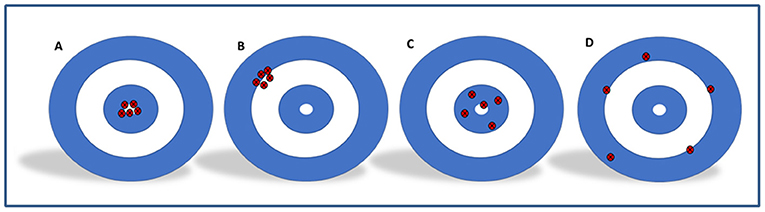
- Figure 2 - Archery helps us to understand diagnostic accuracy and precision.
- Imagine the bullseye is the actual diagnosis of the patient, while the red dots are the values the tests give. (A) The arrows are clustered together and near the bullseye, so the test is both accurate and precise. (B) The arrows are clustered together, so the test is precise, but not near the bullseye, so it is not accurate. (C) The arrows are all near the bullseye but not clustered, so the test is accurate but not precise. (D) The arrows are spread everywhere, so the test is neither accurate nor precise.
Maths in Heart Disease
Many people are monitored using an electrocardiograph (ECG) when they have a suspected or known heart problem or if they are otherwise unwell. ECG measures the size and rhythm of the electrical signals in the heart via electrodes placed on the patient’s chest, arms, and legs. This information can then be mapped onto graph paper (Figure 3A). The ECG graph has a distinctive shape, with letters assigned to specific peaks or troughs. The P wave is the contraction of the atria (chambers at the top of the heart). More to be found in Mending a Broken Heart—The Genetics of Heart Disease. Front Young Minds [3]. The QRS shows contraction of the ventricles (lower parts of the heart). The R wave is large because the ventricles are the biggest part of the heart. The final part of the cycle is shown by the T wave. The various parts of the ECG graph can be analyzed to understand whether the heart is functioning properly.
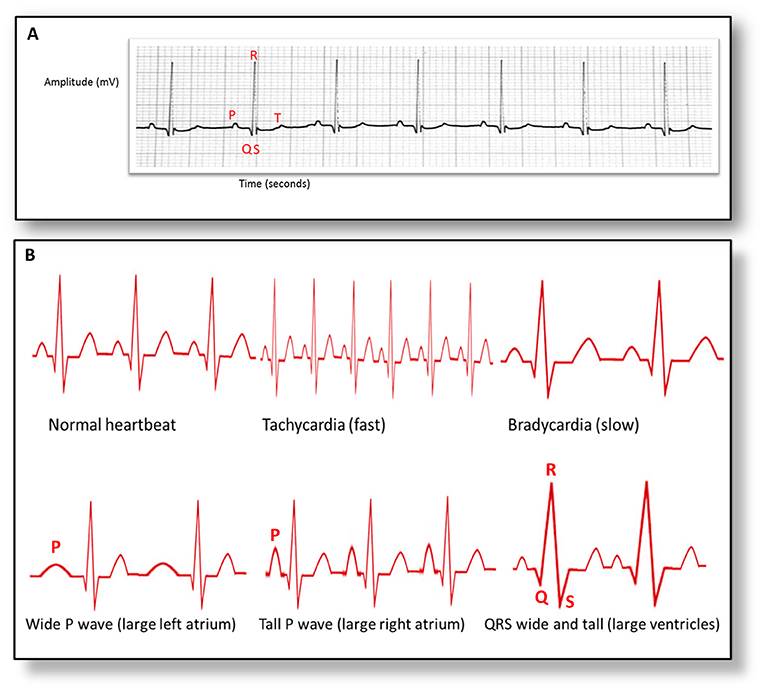
- Figure 3 - An electrocardiogram (ECG).
- (A) Letters represent different phases of the heartbeat cycle. To determine heart rate, the distance between to R waves is measured and converted to time. For example, if the distance between two R waves is 12.5 mm and each mm represents 0.04 s, then 12.5 × 0.04 = 0.5 s between heartbeats. Since heartrate is calculated as beats per minute, 60 s/0.5 = 120 beats per minute. (B) ECG can be used to diagnose various heart disorders, based on the shape and spacing of the waves.
If the shape or timing of these waves is unusual, the heart may be functioning abnormally (Figure 3B). The gap between the R waves shows the heart rate. A fast heart rate is called tachycardia, while a slow heart rate is called bradycardia. Both disorders can be life-threatening. A unusually wide P wave can mean the left atrium is enlarged, while a taller P wave can mean the right atrium is enlarged. T wave abnormalities can have a variety of causes, are quite common, and do not always cause significant problems. If the QRS complex is wide and tall, the ventricles may be enlarged. This is known as cardiomegaly, and can be a sign of heart failure, infection of the heart tissue, or high blood pressure.
Other Uses of Maths in Medicine
Cardiologists and other types of doctors may also want to look at the structure of the heart, blood vessels, or other organs. There are several methods used to image inside the body, including X-ray, computed tomography (CT), ultrasound, and magnetic resonance imaging (MRI) [4]. All these imaging techniques require maths, and the measurements must be accurate, as there is no room for error in medicine.
Once a medical condition has been diagnosed, patients must be monitored, and medications must be given properly. Calculating drug doses relies on maths such as addition, fractions and algebraic equations, and these calculations are extremely important because a dose of medicine that would help an adult could be harmful to a child, whilst a child’s dose might not be enough to help an adult. Many drugs are given per kilogram of bodyweight.
If a patient needs surgery, medical professionals are needed to check the patient’s blood pressure, calculate oxygen levels, monitor body temperature and respiratory rate, and administer the correct doses of anaesthesia and fluids. For more info about anaesthesia see What Is Anesthesia? [5]. By creating and using graphs and equations, these medical professionals can determine whether a patient is getting better or deteriorating, and what the patient needs during treatment.
Conclusions
There are so many ways that maths is vital in human and veterinary medicine. Medical professionals may be calculating the risk of a disease spreading, how much medicine to give, how quickly the heart is beating, or whether a patient is improving or declining. The next time you are doing some maths, think about ways it might be useful for doctors, nurses, veterinarians, scientists, and other people working to make us healthier. If you are thinking of pursuing one of these careers in your future, then remember that your maths classes are just as important as your science classes!
Glossary
Epidemiology: ↑ Study of the distributions and causes/risk factors of diseases and other health conditions in populations.
Incidence Rate: ↑ The rate of new disease cases in a known population size within a given period of time.
Prevalence: ↑ The proportion of a population that has the disease at one point in time.
R0: ↑ The basic reproduction number/rate which shows how contagious an infectious disease is.
Diagnostic Test: ↑ A medical test used to diagnose a disease or a health condition.
Diagnostic Accuracy: ↑ The ability of a test to discriminate the difference between healthy and diseased patients.
Electrocardiograph: ↑ A method used to measure electrical activity in the heart, which helps understand if the heart is functioning correctly.
Conflict of Interest
The authors declare that the research was conducted in the absence of any commercial or financial relationships that could be construed as a potential conflict of interest.
Acknowledgments
Part of this work was made possible due to INSPIRE student scholarship funded by the Wellcome Trust, the Academy of Medical Sciences. This grant awarded to Drs. C. S. Rutland, V. James, K. Braithwaite, K. Cobb, and Professors N. Mongan and G. England to promote research and public engagement. We are grateful to Professor Malcolm Cobb for providing us with an ECG to use in Figure 3. We would also like to thank the Linnean Society and National Literacy Trust for supporting Catrin as a scientific writing ambassador for young people. We also thank the British Science Association and University of Nottingham for awarding Catrin with a BSA Media Fellowship.
References
[1] ↑ Brooks, H., Kanjanasaratool, U., Kureh, Y., and Porter, M. 2021. Disease detectives: using mathematics to forecast the spread of infectious diseases. Front. Young Minds. 9:577741. doi: 10.3389/frym.2020.577741
[2] ↑ Sitch, A. J., Dekkers, O. M., Scholefield, B. R., and Takwoingi, Y. 2021. Introduction to diagnostic test accuracy studies. Eur. J. Endocrinol. 184:E5–9. doi: 10.1530/EJE-20-1239
[3] ↑ Clark, N., Alibhai, A., and Rutland, C. S. 2018. Mending a broken heart—the genetics of heart disease. Front. Young Minds 9:19. doi: 10.3389/frym.2018.00019
[4] ↑ Keane, M., Paul, E., Sturrock, C. J., Rauch, C., and Rutland, C. S. 2017. “Computed tomography in veterinary medicine: currently published and tomorrow’s vision,” in Computed Tomography - Advanced Applications, ed A. M. Halefoglu (London: IntechOpen). p. 271–89.
[5] ↑ Lendner, J. 2021. What is anesthesia? Front. Young Minds 9:524571. doi: 10.3389/frym.2021.524571