Abstract
Carbon dioxide (CO2) is a gas that contributes to global warming. When we burn fuel (for example to drive cars or to generate power) we put more CO2 into the air, which contributes to climate change. Nature is very good at removing CO2 from the air. Trees need it to grow and the oceans can dissolve it. But not all the new CO2 is removed, so the amount in the air increases each year. Every year, we try to predict how much more CO2 we will have. For an accurate CO2 forecast, we must understand how human activity and natural ecosystems affect each other. In this article, we explain how we can make this forecast. For 2020, we predict that CO2 levels will increase faster than average.
What is the Carbon Cycle?
Carbon dioxide (CO2) exists naturally in the earth’s atmosphere. It is a greenhouse gas—you might want to read more about this in Jonny Williams’s article [1] which explains more about how this causes climate change. It is also essential for plants to grow. When plants grow, they absorb CO2 from the air. When they die, the CO2 goes back to the atmosphere. This is known as the carbon cycle. It is a bit like the water cycle, which you probably know about: when it rains on land, the water flows through rivers into the sea. Then it can evaporate again before falling once more as rain. The water just goes round and round in a big cycle.
Something similar happens for CO2 (Figure 1). It can be absorbed by both plants on land and in the ocean (tiny plants called phytoplankton). Via photosynthesis, plants turn the CO2 into the carbon needed to grow their trunks, leaves, or bodies. When the plants die, the carbon goes into the soil where bacteria and microbes eat it and turn it back into CO2. Before humans began to burn lots of fossil fuels about 200 years ago, the total amount of carbon in the cycle remained the same. But now, humans have added more carbon to the carbon cycle by cutting down trees, called deforestation, and burning coal and oil.
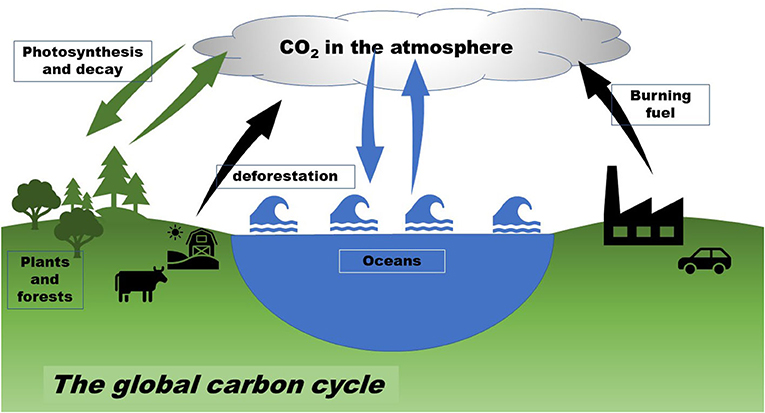
- Figure 1 - The global carbon cycle.
- Trees and plants absorb CO2 and turn it into the carbon they need to grow, through photosynthesis. The carbon returns to the atmosphere as CO2 when dead plants and leaves decay. Oceans absorb carbon and release it back to the atmosphere. Human activities, like burning fossil fuels and cutting down trees, put more CO2 into the atmosphere.
How Has CO2 in the Air Changed Over History?
In 1958, scientists started to measure the CO2 in the air directly. For thousands of years, it was constant. If you examined one million molecules of air, 280 of these would be CO2. We call this parts per million (ppm). So, we would say that the CO2 concentration for many years was 280 ppm. About 200 years ago as industrialization began, humans started to cut down more and more forests and to burn fossil fuels, like coal and gas. These activities put more CO2 into the air. Since about 1850, the concentration of CO2 in the air has increased. Scientists first measured CO2 in the air in Mauna Loa, Hawaii, where there is an observatory on top of a large volcano. This is a good place to measure CO2 because it is away from large land areas where there is more pollution. A famous scientist called Charles Keeling kept these measurements going [2] and now we can see that, since 2016, CO2 has reached more than 410 ppm (Figure 2). This is the main reason our climate has warmed by about 1°C since the industrial revolution.
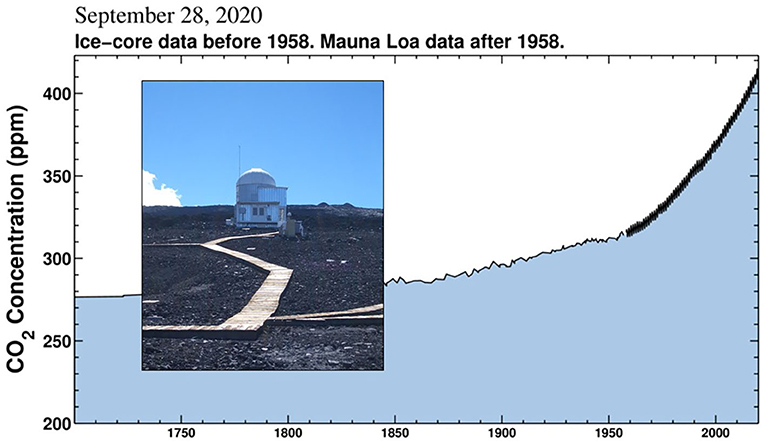
- Figure 2 - CO2 is measured in the air at an observatory in Mauna Loa, Hawaii (photograph), by scientists from the Scripps Institute of Oceanography.1
- The graph shows that CO2 has increased from about 280 ppm before human activity started to put lots more CO2 into the air, to more than 410 ppm in 2020.
What Makes the Amount of CO2 in the Atmosphere Change?
We know that human activity puts more CO2 in the atmosphere, but we also know that the carbon cycle removes some of it. This makes it quite complicated to understand how much more CO2 will continue to be added to the air. Scientists have worked very hard to measure what is happening with CO2, and now we know that about half of the CO2 emissions stay in the air. Plants and oceans absorb the rest. In other words, if we burn fossil fuels and create 4 tons of CO2, then about 2 tons will stay in the air, 1 ton will be absorbed by plants, and 1 ton by the oceans.
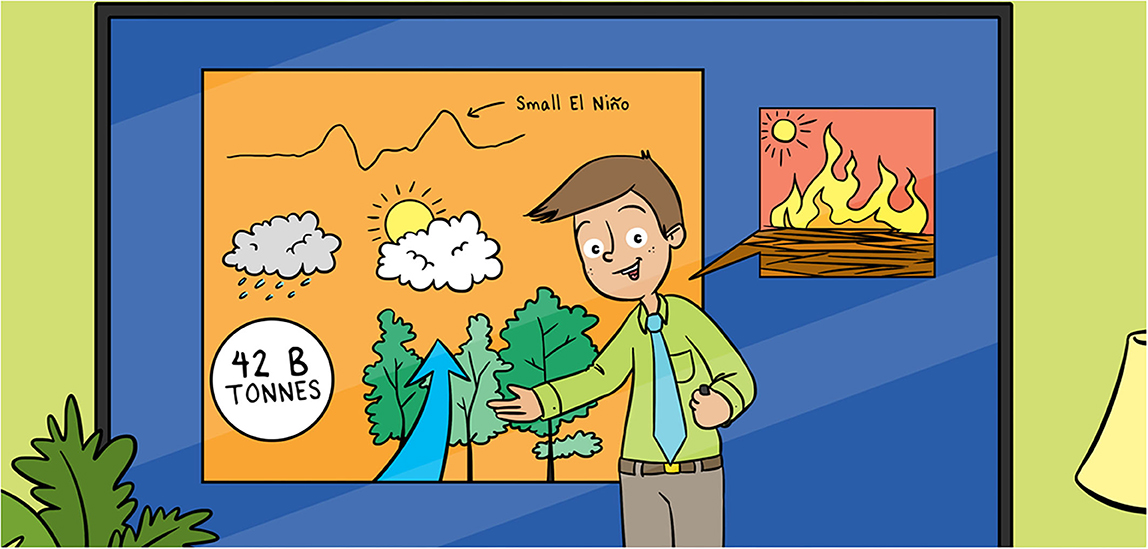
We know that the amount of CO2 in the air increases every year. This trend is caused by people burning fuels and cutting down trees. We can also see that, in some years, CO2 increases more quickly than in others. This is true even if the amount of fuel we burn is about the same, and results from different types of weather. Some years are hot and some are cold. Weather differences can change the amount of CO2 that is absorbed. A weather pattern called El Niño happens approximately every 4 years, making some places hotter and drier than normal. The warmer weather can slow down plant growth and cause more fires, which means more CO2 in the air than normal. Figure 3 shows the changes in CO2 each year—we call this the growth rate. In hot years, the growth rate is greater than in cold years.
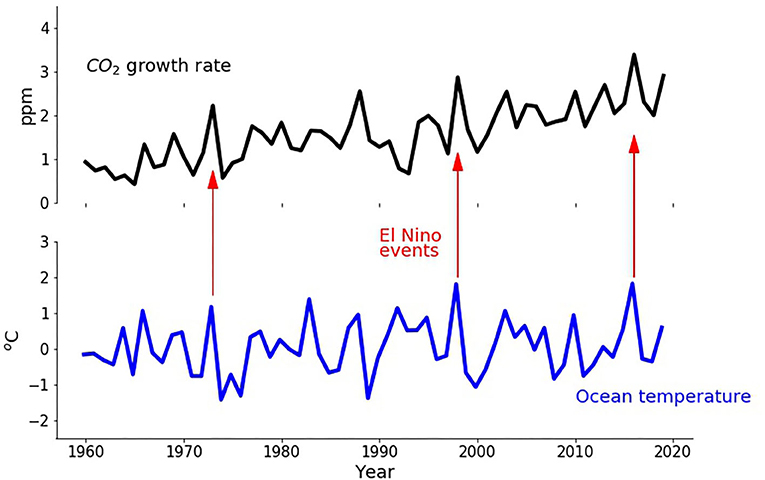
- Figure 3 - The CO2 growth rate, which is the amount that CO2 in the air increases every year, is shown with a black line.
- The blue line shows how much the tropical Pacific Ocean temperature is above or below normal. You can see that CO2 increases by about 2 ppm each year, with an average growth of 1.6 ppm per year over this whole period. Since 2000, the average growth rate was 2.2 ppm per year. Hot years caused by El Niño lead to greater CO2 growth, as you can see by the red arrows.
CO2 Forecasting
The process of predicting how much CO2 will end up in the air each year is called CO2 forecasting. For accurate CO2 forecasting, we must understand three processes: how much fuel the world is using, how much forest is being cut down, and how the weather will change natural processes.
At the end of 2015, we knew from seasonal weather forecasts that a big El Niño was going to happen. So, we expected that CO2 in the air would grow more quickly than ever before. We made a forecast and wrote a paper about this [3]. At the end of 2016, we measured the CO2 at Mauna Loa to check whether our forecast was right. It turned out we had correctly predicted the biggest CO2 increase ever seen, and that CO2 was now more than 400 ppm. Now, every year, we repeat our CO2 forecast for the next year.2
For 2020, our seasonal forecast predicts that there will be a small El Niño. This means CO2 will grow faster than usual, but it will not be a record. If our forecast is correct, it will be the fourth biggest increase seen in CO2. We also expect that the world will burn about the same amount of fuel as last year [4], releasing about 42 billion tons of CO2, which is more than 5 tons of CO2 for every person in the world! When we combine these facts, we can predict that CO2 will increase by 2.74 ppm and the average for 2020 will be 414.2 ppm. This is the highest CO2 level for over a million years.
You may have seen the news that Australia had some very hot weather at the end of 2019 and early 2020, which led to some huge fires. The fires affected lots of people, homes, and animals, but they also burnt down many trees, which put more CO2 in the atmosphere. We can use satellites to measure how many fires there were and to estimate how much CO2 this caused. From our analyses, we think that these fires made the CO2 increase about 2% faster than previous years. We also know that people have used less fuel, especially for transport, because of the Covid-19 pandemic. This means CO2 emissions might be a bit smaller in 2020 [5], so we expect about 0.3 ppm smaller growth3 of CO2.
Why is CO2 Forecasting Important?
We know that our climate is changing and that these changes are having some devastating effects on people around the world. We have seen more storms, more droughts, and more fires like those in Australia. Some of these might happen anyway, but with climate change we know they will happen more often. We know it is extremely important to try to stop climate change from getting even worse. To stop it from getting too bad, we should all try to reduce the amount of new CO2 we put in the air. If we can understand how natural processes take CO2 out of the atmosphere, then we can calculate how much we must reduce our use of fuel. We call this a carbon budget. You might have a budget for spending your money, which tells you how much to spend on food, clothes, and so on. Scientists can work out a carbon budget, which measures how much fuel we can use before climate change becomes too dangerous.
Our CO2 forecast is part of the research that we need to help understand the global carbon cycle. We now know that we can predict the world’s carbon cycle very accurately for 1 year. This will help us improve how we predict CO2 growth for many years in the future, which can help the world plan ways to avoid the dangers of climate change.
Stretch and Challenge!
If you like maths, here is the equation we use to make our forecast.
We add together the CO2 made by burning fossil fuels and deforestation. We call this the emissions, and use the symbol “E”. For 2018, 36.9 billion tons of CO2 came from fossil fuels and 5.5 billion tons from deforestation [4]. So, E = 36.9 + 5.5 = 42.4 billion tons of CO2.
We also need a forecast of the ocean temperatures. We call this “N” to stand for El Niño. The Met Office forecast predicts N = 0.59°C for 2020.
Now we can calculate the CO2 growth rate for 2020 using an equation, multiplying E and N by some numbers called coefficients. The coefficients were determined by looking at the data for the past and using a mathematical technique called regression.
CO2 growth rate = 0.07 + (0.43 × N) + (0.057 × E)
= 0.07 + 0.25 + 2.42
= 2.74 ppm
Now imagine that, in 2021, emissions might increase to 43 billion tons, but maybe we might have a cold La Niña and N = −1°C. Can you work out what the CO2 growth rate would be?4
Glossary
Carbon Dioxide (CO2): ↑ A gas in the atmosphere that is created when we burn fossil fuels. CO2 is a greenhouse gas and can stay in the air for many years. It is the main cause of climate change.
Greenhouse Gas: ↑ A gas in the atmosphere which can absorb heat and cause the planet to warm up. These occur naturally, such as carbon dioxide and water vapor, but human activity is putting more greenhouse gases into the air leading to the planet getting warmer.
Carbon Cycle: ↑ The movement of carbon through nature—plants absorb CO2 from the air as the grow, and release it again when they die. The water in the oceans dissolves CO2. This cycle is called the carbon cycle.
Fossil Fuel: ↑ Fuels, such as coal, oil, and natural gas that were formed millions of years ago when plants and animals died and became buried. Burning fossil fuels creates CO2, which goes into the atmosphere.
El Niño: ↑ A weather pattern that happens approximately every 4 years. The temperature of the Pacific Ocean gets warmer and this leads to hotter and drier weather in many regions. The opposite pattern is called La Niña, which leads to cooler temperature around the world.
Growth Rate (of CO2): ↑ We know that there is more CO2 in the air every year, because we can measure it. But some years it increases faster than others. The amount that it changes is called the “growth rate”.
CO2 Forecasting: ↑ We know that the amount of CO2 in the air will increase every year, but we do not know exactly how much. We use our knowledge of the carbon cycle to predict how much more CO2 we will get. This is our CO2 forecast.
Carbon Budget: ↑ We know that putting more CO2 into the air causes climate change. By understanding how the carbon cycle works we can work out how much CO2 will cause a dangerous level of climate change. We need to make sure that we burn less fossil fuel than this amount of carbon—which we call the carbon budget.
Conflict of Interest
The authors declare that the research was conducted in the absence of any commercial or financial relationships that could be construed as a potential conflict of interest.
Footnotes
1. ↑ You can see this figure, and the latest measurements on their website here: https://scripps.ucsd.edu/programs/keelingcurve/
2. ↑ You can see the forecast for this year (2020) here: https://www.metoffice.gov.uk/research/climate/seasonal-to-decadal/long-range/forecasts/co2-forecast
3. ↑ https://www.carbonbrief.org/analysis-what-impact-will-the-coronavirus-pandemic-have-on-atmospheric-co2
4. ↑ Stretch and Challenge Answer: The growth rate would be 2.091 ppm. Did you get it right?
References
[1] ↑ Williams, J. 2020. Computing the climate: building a model world. Front. Young Minds 8:161. doi: 10.3389/frym.2019.00161
[2] ↑ Keeling, C. D., Piper, S. C., Bacastow, R. B., Wahlen, M., Whorf, T. P., Heimann, M., et al. 2001. “Exchanges of atmospheric CO2 and 13CO2 with the terrestrial biosphere and oceans from 1978 to 2000. I. Global aspects,” in SIO Reference Series, No. 01-06 (San Diego, CA: Scripps Institution of Oceanography). p. 88. Available online at: http://escholarship.org/uc/item/09v319r9
[3] ↑ Betts, R., Jones, C., Knight, J., Keeling, R. F., and Kennedy, J. J. 2016. El Niño and a record CO2 rise. Nat. Clim. Change 6:806–10. doi: 10.1038/nclimate3063
[4] ↑ Friedlingstein, P., Jones, M. W., O’Sullivan, M., Andrew, R. M., Hauch, J., Peters, G. P., et al. 2019. Global carbon budget 2019. Earth Syst. Sci. Data 11:1783–838. doi: 10.5194/essd-11-1783-2019
[5] ↑ Le Quéré, C., Jackson, R. B., Jones, M. W., Smith, A. J. P., Abernethy, S., Andrew, R. M., et al. 2020. Temporary reduction in daily global CO2 emissions during the COVID-19 forced confinement. Nat. Clim. Chang. 10:647–53. doi: 10.1038/s41558-020-0797-x