
Abstract
Ever wonder how we have found that tobacco, alcohol, and even too much sugar are harmful? Epidemiology is a branch of medicine that studies how often diseases occur in different groups of people and why. By following and studying a large number of people, it is possible to identify behaviors that will have an impact on health. This impact can be negative (as with alcohol, tobacco, and junk food) or positive (as with doing sports and eating fruits and vegetables). In this article, we will explain how epidemiological studies can be used to identify substances or behaviors that impact health, and how to know whether we can trust the results of such studies when we see them on the news.
Identify a Potential Risk Factor
Epidemiology is a branch of medicine that studies how often diseases occur. Epidemiological studies are focusing on identifying risks factors and are important for the prevention of the diseases and to adopt measures to increase the health of the population (Public Health).
The first thing to do before starting any epidemiological study is to identify behaviors that are either potential risk factors for health, or potentially protective for health. Although today some risk factors appear quite obvious to us, like tobacco or alcohol consumption, this has not always been the case—there was a time when these links were not so obvious. Currently, there is plenty of research going on to study the effects of electronic cigarettes, Wi-Fi, pesticides, and a lot of other potential risks to human health. Once a behavior or a substance that might influence human health has been identified, we need to design a study to evaluate its impact on health. In this article, we will explain the principles of epidemiology using the example of the association between the exposure (tobacco) and the outcome variables (lung cancer). Tobacco is probably the best example to use, because it has a long history. The consumption of cigarettes began in the early 1900s and increased for many years afterwards, because the dangers of smoking had not yet been identified. Some early studies on the effects of tobacco were done during the 1920s and 30s, but it was not until the 1950s that the first large-scale studies were performed [1].
Design a Study
The first step toward determining if something is helpful or harmful to human health is to design a study. Basically, if you want to assess the link between a risk factor and a particular disease, you have two possibilities: you can start from the risk factor and try to connect it to the disease, or start from the disease and try to work back to the risk factor that caused it (Figure 1).
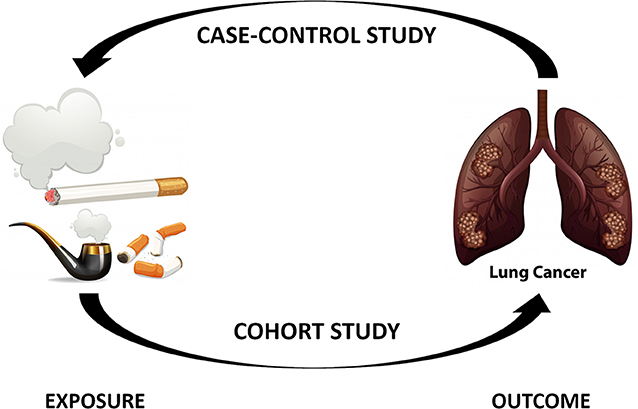
- Figure 1 - The two main types of epidemiological studies.
- Case-control studies begin with the disease and work backwards toward identifying the exposure factors that led to the disease, so we call them retrospective. In cohort studies, we start from the exposure and separate the exposed and non-exposed subjects, then wait to see whether the disease appears. This is called a prospective study.
Let us first discuss starting from the disease and trying to identify the risk factor. We will continue with our example of tobacco. If you think that tobacco causes lung cancer, you can go to the hospital and ask patients with lung cancer if they smoke or used to smoke [2]. This information by itself is not very useful, because we need to compare it to the same information obtained from healthy people without lung cancer. To do this, we need to find healthy people who have other characteristics (like age, gender, profession, hobbies, etc.) that are as similar as possible to the group of lung cancer patients. This group is called the control group. Once we have collected the data from both groups, we can put the results into a table, separated by whether the people were exposed to the risk factor (tobacco, in our case) or not and whether they had lung cancer or not (Table 1).
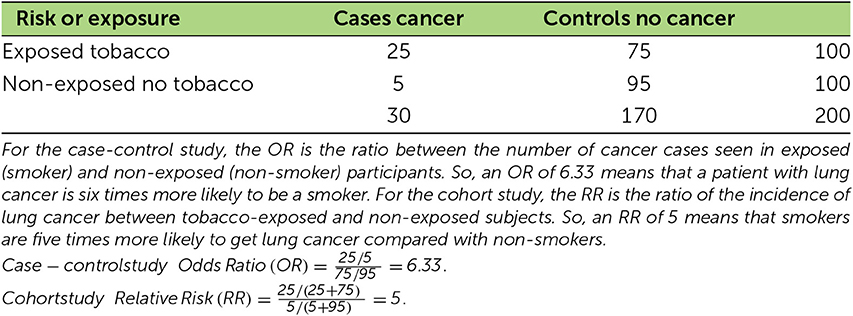
- Table 1 - Table showing calculations from the results of case-control and cohort studies.
We can then compute two first ratios (number of exposed/number of non-exposed): one for the cases (patients with lung cancer) and one for the control group. Finally, we can compute the ratio of these two first ratios, referred to as the odds ratio (OR), which represents the probability for a patient with cancer to be a smoker. For example, an OR of 6.3 means that a patient with lung cancer is six times more likely to be a smoker.
We call this type of analysis a case-control study, because we are comparing patients to a control group. It seems nice, but we will see in the next section that there are some limitations to this type of study.
The second option is to start from the risk factor and wait for the disease. Again, we need to have a control group with which to compare the results of the exposed group. This is what epidemiologists started doing in 1950, to study the effect of tobacco on lung cancer [3]. At the beginning of the study, both groups must be as similar as possible, with the only difference between them being the risk factor, such as whether or not they use tobacco. From an ethical point of view, we obviously cannot force people to do something potentially harmful, so we have to find people who are already willingly exposed to the risk factor. After a certain period of time, which varies greatly depending on the disease studied, we can compute the incidence, or the number of new cases of disease over a period of time, for both groups (number of cases/number of people in the group). Finally, we can compute the risk ratio (RR), which is the risk of developing the disease for the exposed people compared with the non-exposed people. For example, an RR = 5 indicates that smokers are five times more likely to get lung cancer compared with non-smokers.
This kind of study is called cohort study, because we are following up with people over time. Usually, cohort studies are more powerful than case-control studies, because they are less likely to be influenced by biases, which will be discussed below.
There are other study designs, but case-control studies and cohort studies are the most popular and frequently used. Now we will discuss a very important point in the current context of fake news and misinformation: can we believe in the results of epidemiological studies?
Quality of the Study … and the Results!
For someone who is not familiar with epidemiology and is reading the results of a study, the best way to determine whether the results can be interpreted with confidence or not is to look at … the confidence intervals! Confidence intervals are a range of value around the estimation based on the study that likely contain the true value of the whole population. In a good study, the OR and RR are never presented alone, but together with their confidence intervals (usually a 95% confidence interval, meaning that if we repeat the same experiment 100 times, the results will be within that range 95 times). We would not go into the details of calculating confidence intervals, but to keep it simple, a well-conducted study with enough subjects and not too much variation in the results will give narrow confidence intervals, indicating that the results can be trusted. In Figure 2, you can see the risk of having lung cancer for a former smoker and current smoker, compared with a non-smoker. This study has reasonable confidence intervals, so the results can be trusted.
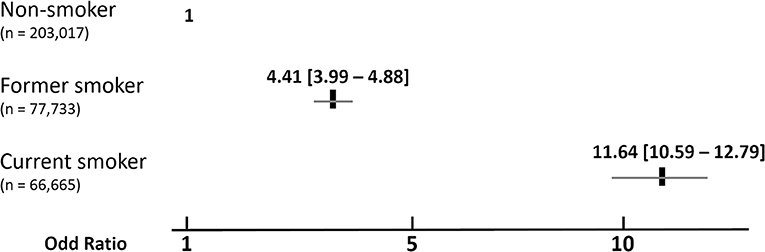
- Figure 2 - Results of a study on the influence of smoking on lung cancer.
- The odds ratio represents the risk of having lung cancer between non-smokers, former smokers, and current smokers, n means the number of participants that have been followed in the different groups. The scale at the bottom of the figure represents the OR, we use this kind of representation to ease the interpretation and to directly visualize the importance of the studied risk factors. The gray lines under the ratios for current and former smokers indicate the 95% confidence intervals (the values are also presented into the brackets), as explained in the text. From these results, you can see that smoking is associated with an important increased risk of having lung cancer (OR = 11.64) and that this risk this risk decreases significantly if subjects stop smoking but is still greater than for people who have never smoked (adapted from Christensen et al. [4]).
Bias
We have just seen that the confidence intervals can be used to assess the quality of a study, and they are a good indicator, but studies with narrow confidence intervals can still be totally biased! What is bias? It is a type of error that will lead to incorrect conclusions from the data. There are plenty of possible biases, but the two most important kinds are called selection biases and information biases. To put it simply, selection bias occurs when the improper patients or controls are selected for the study. In the study of tobacco and lung cancer, a selection bias would occur if some of the control actually had undiagnosed lung cancer, for example.
Information bias occurs when the information from the two groups is not obtained in the same way. For example, the investigator of a study can ask much more questions to patients with lung cancer about tobacco consumption compared to interviews with the healthy control patients. A common type of information bias is called recall bias: in some studies, we need to go back 20 or 30 years, so it is often difficult for people to remember or sometimes they are ashamed of their past behaviors and do not tell the truth, or they do not think that smoking a few cigarettes 20 years ago is considered as smoking.
Biases can seriously affect the outcome of a study, so it is important to be aware of them and to discuss the potential influence of the various types of bias when presenting the results of a study!
Principle of Causality
We have discussed the design of an epidemiological study, the confidence intervals, and the biases. If everything has been done correctly, does that mean that tobacco causes lung cancer? Not necessarily! We still have to think about the causality—the relationship between causes and effects. Just because two things, like tobacco use and lung cancer, seem to be associated with each other does not definitely mean that one causes the other. For example, if we still considering lung cancer, the OR or RR are higher for alcoholic people compared to people who are not drinking, but it does not mean that alcohol causes lung cancer! Actually the alcohol is a confounding factor: alcoholics tend to smoke more than non-alcoholics which explains this association.
So, how do we know if our results are truly causal or if they are just associated with each other? There are several ways to do this. Criteria to help determine if observed epidemiological associations are causal have been proposed [5], the most important are the strength of the association (the higher the OR or RR are, the more likely it is to be causal), the temporality (exposure must precede the onset of disease), and the biological gradient (an increased exposure (for example the number of cigarettes/day) resulted in increased lung cancer). They provide the clearest evidence of a causal relationship.
Conclusion
In this article, we have described the different steps of an epidemiological study: identifying a risk factor, choosing the appropriate study design, and trying to minimize the influence of bias as much as possible. Once the data has been obtained and the results computed, the results must then be interpreted and causality must be established. Finally, once the conclusion has been reached and a risk factor has been identified, the most important part is to inform the public and politicians, so that everyone can work together to establish preventive measures to decrease or minimize the impact of this factor on public health.
Glossary
Epidemiology: ↑ The branch of medicine that deals with the incidence, distribution, and possible control of diseases and other factors relating to health.
Population: ↑ An identified group of people that will be investigated in a study.
Outcome Variable: ↑ The object of the study, in most of the study we are interested in a disease or in death.
Control Group: ↑ Group of people used as comparison. Depending on the type of study, it can be a group of healthy people (case-control study) or a group not exposed to the risk factor (cohort study).
Case-control Study: ↑ Type of study in which the outcome (for example, having lung cancer) is used to define the groups (cases and control) and epidemiologists try to identify the exposure that led to the outcome (tobacco).
Incidence: ↑ Number of new cases over a given period of time.
Cohort Study: ↑ Type of study in which the exposure (for example, tobacco use) is used to define the groups (smokers—exposed or non-smokers—non-exposed) and epidemiologists then wait to see if disease occurs.
Confidence Intervals: ↑ A range of values around the measured value that likely contain the true value of a variable in the population. It is a mathematical way to determine whether the results of a study can be viewed with confidence.
Conflict of Interest
The author declares that the research was conducted in the absence of any commercial or financial relationships that could be construed as a potential conflict of interest.
References
[1] ↑ Doll, R., Peto, R., Boreham, J., and Sutherland, I. 2004. Mortality in relation to smoking: 50 years’ observations on male British doctors. BMJ 328:1519. doi: 10.1136/bmj.38142.554479.AE
[2] ↑ Meyers, T. J., Chang, S.-C., Chang, P.-Y., Morgenstern, H., Tashkin, D. P., Rao, J.-Y., et al. 2017. Case-control study of cumulative cigarette tar exposure and lung and upper aerodigestive tract cancers. Int. J. Cancer 140:2040–50. doi: 10.1002/ijc.30632
[3] ↑ Doll, R., and Hill, A. B. 1954. The mortality of doctors in relation to their smoking habits. Br. Med. J. 1:1451–5.
[4] ↑ Christensen, C. H., Rostron, B., Cosgrove, C., Altekruse, S. F., Hartman, A. M., Gibson, J. T., et al. 2018. Association of cigarette, cigar, and pipe use with mortality risk in the US population. JAMA Intern. Med. 178:469–76. doi: 10.1001/jamainternmed.2017.8625
[5] ↑ Fedak, K. M., Bernal, A., Capshaw, Z. A., and Gross, S. 2015. Applying the Bradford Hill criteria in the 21st century: how data integration has changed causal inference in molecular epidemiology. Emerg. Themes Epidemiol. 12:14. doi: 10.1186/s12982-015-0037-4