
Abstract
In the coming years, humans will have choices to make about where we get the fuel that powers our lights for us to see at night, our stoves for our hot meals, our water heaters for our warm baths, and even our cars. These choices will affect the air we breathe: burning fuel often causes pollution, like the smog found in cities, and almost always leads to more greenhouse gases in the air. Smog and greenhouse gases affect the way the Earth cools itself. One choice we have today is: which fuel should we use for our power plants, coal or natural gas? In a recent study, my colleagues and I measured the greenhouse gas emissions from three of the largest natural gas fields in the United States. We found that using natural gas instead of coal to fuel power plants could lead to fewer greenhouse gases in the air.
Humans have burned coal to make electricity for over a hundred years. Coal is made up mainly of the element carbon. When coal is burned as a fuel to generate electricity, this carbon is released into the air as carbon dioxide. Carbon dioxide is a greenhouse gas, meaning that, as it builds up in the atmosphere, it allows the sun’s visible light to come in and reach the Earth’s surface, but it traps the heat that the Earth emits. Therefore, changing the amount of carbon dioxide in the air changes the way the Earth cools and may lead to climate change.
Natural gas, which is formed in reservoirs underground and composed mostly of a gas called methane, can also be used as a fuel to generate electricity. One benefit of natural gas is that it releases less carbon dioxide than coal when it is used to produce electricity. However, methane is also a greenhouse gas and is actually much more effective at trapping the Earth’s heat than carbon dioxide. As a result, when natural gas is withdrawn from under the ground, any methane that escapes or “leaks” into the air will cancel out some of the benefit of using it as a fuel. Therefore, figuring out the amount of methane that leaks from underground before it is burned as fuel will help us to determine which fuel is better for Earth’s climate: natural gas or coal.
Natural gas is extracted from many areas around the nation using wells drilled deep into the ground (Figure 1). A natural gas field can have thousands of wells, and each well may have dozens of spots that could leak natural gas. How do we know how much methane escapes to the air from an entire natural gas field?
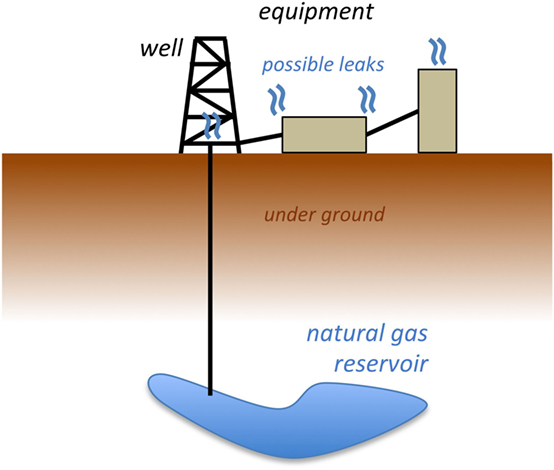
- Figure 1 - Diagram of a natural gas well, drilled into a reservoir deep below the earth’s surface.
- Once the natural gas is above ground, there are many places it can leak into the air.
One way scientists like me answer this question is by measuring the methane in the air with a scientific instrument aboard a research airplane. I install my methane measurement instrument in the airplane (Figure 2), then stick a small tube outside of the airplane and continuously draw outside air through the tube and into the instrument (Figure 3). Normally, there are about two molecules of methane for every one million molecules of air, so the instrument needs to be extremely sensitive! Once inside the methane measurement instrument, the air enters a special cavity with very reflective mirrors. A laser beam is fired into the cavity and bounces back and forth between the mirrors (Figure 3). The methane in the air absorbs this laser light. The more methane there is, the more laser light is absorbed, so by measuring the amount of laser light in the cavity, I can tell just how much methane is in the air.
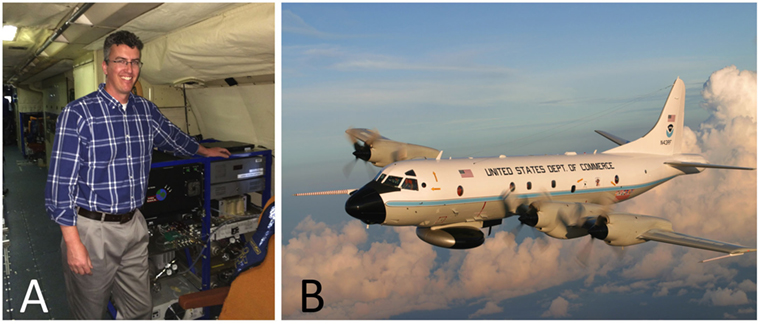
- Figure 2
- A. This is a picture of me standing next to my instruments in the NOAA P-3 research airplane. It takes my colleagues and me about a month to install all of our scientific instruments in the airplane. B. The NOAA P-3 research airplane. Photograph from http://www.aoml.noaa.gov/hrd/pix/template/NOAA_P3_flight.jpg.
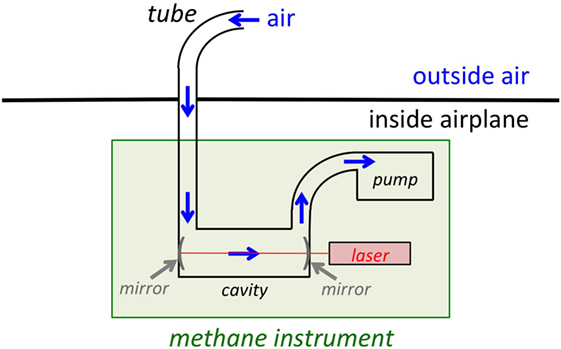
- Figure 3 - Diagram of my methane instrument.
- Air is taken from outside the airplane through a tube. This air enters the cavity, where a laser beam is bounced between two mirrors. The methane in the air absorbs this laser light. By measuring how much light is in the cavity, we know how much methane is in the air.
In 2013, I put this instrument on a NOAA P-3 research airplane (Figure 2), which is famous for flying into hurricanes. Luckily, I did not have to fly into any hurricanes (!), but my colleagues and I did fly to three of the largest natural gas fields in the United States to measure how much methane was leaking from each one. Figure 4 shows one example of a flight to a natural gas field located on the border of Texas and Louisiana. Using the P-3 research airplane, I measured methane upwind and downwind of each natural gas field, and I determined how much methane was coming from each field. How did I do this? Imagine you take a freshly baked pie outside on a breezy day. You can smell the pie better when you are downwind of it compared to when you’re upwind of it. That is because the good smell that the pie gives off moves with the wind. In this case, the pie is the source of the good smell, and your nose detects more of the good smell downwind of the source. Similarly, my methane measurement instrument (your nose) detects more methane (good pie smell) in the air downwind of the natural gas production regions (the pie). In Figure 4, the natural gas production areas are shown with black and green squares, and the path of the airplane is shown by the black line, which is mostly covered over by various colors that indicate the amount of methane detected. The most methane in the air was measured downwind of these areas, as shown with the red parts of the airplane track. Next, I plugged the data into a math equation, which is basically the difference in methane in the air between downwind and upwind, multiplied by the wind speed, multiplied by the size of the lower atmosphere. In these cases, the lower atmosphere is big: tens of kilometers wide by 1 or 2 km high. This equation tells me how much methane is emitted from the natural gas field.
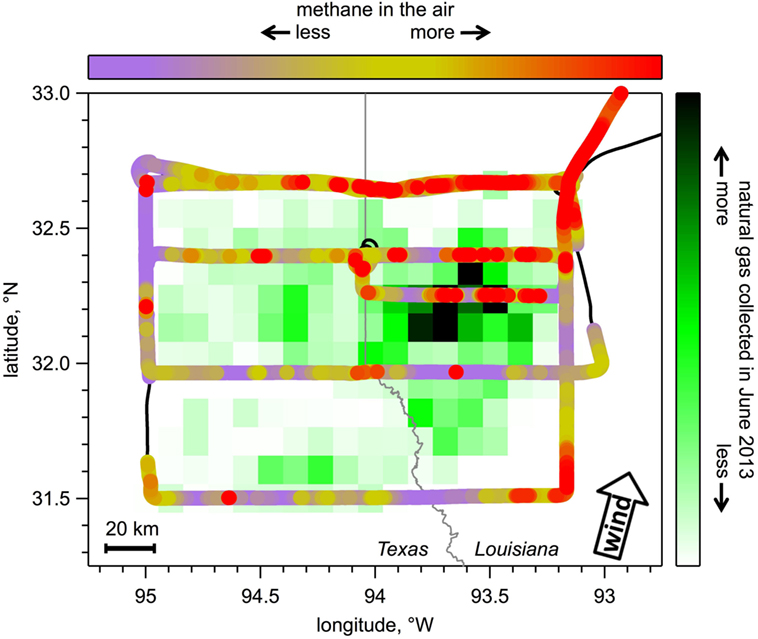
- Figure 4 - This map shows the flight track of the NOAA P-3 research airplane (thick black line) colored by the amount of methane we measured in the air during the flight.
- The scale can be seen at the top – the warmest colors, yellow and red, show more methane; purple shows a background level of methane. There is always some methane present in the air normally. Also shown is the natural gas production in the area we flew over, with dark green and black rectangles showing the areas where the most natural gas is removed from under the ground. Generally, there was more methane in the air downwind (wind direction is shown with the arrow in the right corner) of the natural gas field than there was upwind, and the highest methane measured in the air was downwind of the regions where most of the natural gas was collected. In other words, there is more red downwind of the black and green areas.
How do we know that the methane comes from the natural gas field, and not another source, like big herds of cattle, which are known to produce lots of methane? In addition to methane, my colleagues and I also measured other chemicals, including ammonia and ethane, from aboard the airplane. Cows release methane along with ammonia into the air, but no ethane. Natural gas, on the other hand, contains both methane and ethane, but no ammonia. Therefore, we can tell the source of the methane depending on whether or not there is more ammonia or ethane in the air. In each of the three natural gas fields we studied, the increase in methane in the air downwind of each field corresponded with an increase in ethane, but not ammonia. Therefore, we concluded that natural gas operations were the major source of the methane in the atmosphere.
Finally, we compared the amount of methane leaking from the natural gas fields with the amount of natural gas that was taken from the ground (Figure 5). Figure 5 shows the results from all the studies so far that used a methane measurement instrument and an airplane to measure methane leakage from natural gas fields. The two left columns of Figure 5 show the results from studies in Colorado and Utah that took place before our study. The three right columns show the results from our study. The top section of Figure 5 shows the volume of natural gas collected from underground, or produced, from the five natural gas fields. You can see that the three fields in my study accounted for a lot of natural gas production! The middle section shows how much methane was leaked into the air from these fields. The bottom section, the loss rate, is a ratio of what was leaked to what was collected. For example, 1.6% of the natural gas produced in the Haynesville field was leaked and lost to the atmosphere. Other scientists [1] have determined that power plants burning natural gas produce fewer greenhouse gases than coal-burning power plants only if the leak rate is below around 3.2%. The good news was that the amount of methane I found leaking to the air from each of these large natural gas fields was lower than 3.2%. The amount of methane leaking was also lower than what was found in previous studies from other natural gas fields in Colorado and Utah, which we did not know until we studied these larger production fields. We still have more work to do to figure out whether this low leak rate holds true for other areas of natural gas production in the United States. We are using the P-3 and other research airplanes to take methane measurements in many different places to make sure we really understand what is going into our air. This information is needed to make the best choices between different fuels to minimize the negative effects on Earth’s climate.
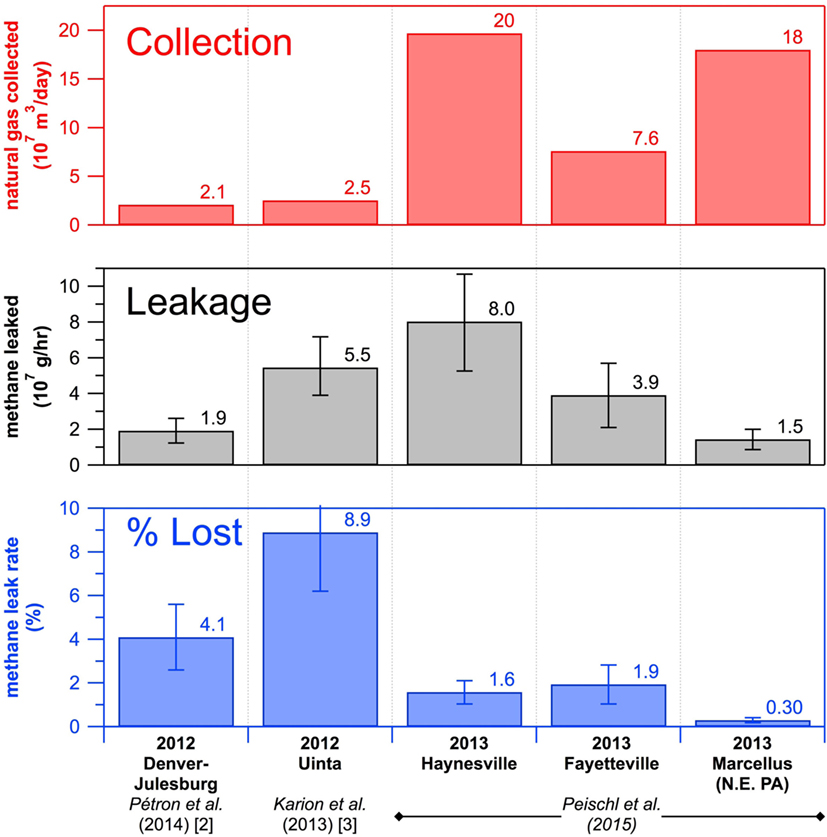
- Figure 5 - A summary of the natural gas production, methane emissions, and methane loss rates from the five natural gas producing regions studied using a methane instrument aboard a research airplane.
- The three fields discussed in this paper are shown on the right. They are the Haynesville field in Texas and Louisiana, the Fayetteville field in Arkansas, and the Marcellus field in Pennsylvania. These three fields produce more natural gas (top plot) but have a lower percentage of methane leakage (bottom plot) compared with the Denver-Julesburg field in Colorado and the Uinta field in Utah shown on the left side, which are from another study which we did not perform.
Glossary
Smog: ↑ Pollution in the air that is hazy and unhealthy to breathe.
Greenhouse gas: ↑ A gas in the air that allows the sun’s visible light to pass through it, but absorbs heat and does not let it escape back out into space.
Natural gas: ↑ A mixture of mostly methane with other gases such as ethane and propane that is used as a fuel in homes for heaters and stoves, as well as in power plants for electricity generation.
Laser: ↑ A device that emits a very specific wavelength of light.
Conflict of Interest Statement
The authors declare that the research was conducted in the absence of any commercial or financial relationships that could be construed as a potential conflict of interest.
Original Source Article
↑ Peischl, J., Ryerson, T. B., Aikin, K. C., de Gouw, J. A., Gilman, J. B., Holloway, J. S., et al. 2015. Quantifying atmospheric methane emissions from the Haynesville, Fayetteville, and northeastern Marcellus shale gas production regions. J. Geophys. Res. Atmos. 120:2119–2139. doi:10.1002/2014JD022697
References
[1] ↑ Alvarez, R. A., Pacala, S. W., Winebrake, J. J., Chameides, W. L., and Hamburg, S. P. 2012. Greater focus needed on methane leakage from natural gas infrastructure. Proc. Natl. Acad. Sci. U.S.A. 109:6435–40. doi:10.1073/pnas.1202407109
[2] ↑ Pétron, G., Karion, A., Sweeney, C., Miller, B. R., Montzka, S. A., Frost, G., et al. 2014. A new look at methane and nonmethane hydrocarbon emissions from oil and natural gas operations in the Colorado Denver-Julesburg Basin. J. Geophys. Res. Atmos. 119:6836–52. doi:10.1002/2013JD021272
[3] ↑ Karion, A., Sweeney, C., Pétron, G., Frost, G., Hardesty, R. M., Kofler, J., et al. 2013. Methane emissions estimate from airborne measurements over a western United States natural gas field. Geophys. Res. Lett. 40:4393–7. doi:10.1002/grl.50811