Abstract
Have you ever wondered what is in the water we drink, swim in, or see flowing through rivers and lakes? Water quality affects not just plants and animals but also humans, so it is important to know if our water is clean or polluted, and how this changes over time. By monitoring factors such as temperature, pH, turbidity (how clear the water is), and even looking for visible pollutants such as microplastics, we can determine what is in our water and how healthy it is as a vital part of the environment. As you read this article, you will discover how scientists and communities work together to monitor and protect our water, ensuring it stays safe for everyone.
Water is Everywhere!
Water is everywhere: in the rivers we kayak on or walk along, the ponds where frogs live, and even in our taps at home. But how do we know if our water is clean? Scientists use special tools to measure different features of water, like temperature, clarity, and the presence of pollution such as chemicals or tiny bits of plastic. These measurements help us understand the health of our environment and can warn us about pollution before it gets out of hand (Figure 1). The number of pressures on our water has been increasing, due to factors such as climate change, population growth, increase in runoff of pesticides and fertilizers from farmland, and an increase in the amount of chemicals and materials such as plastics that we use in our day-to-day lives, all of which can end up in the environment too. This makes monitoring water quality vitally important, as we depend on water for drinking, food production, and recreation [1].
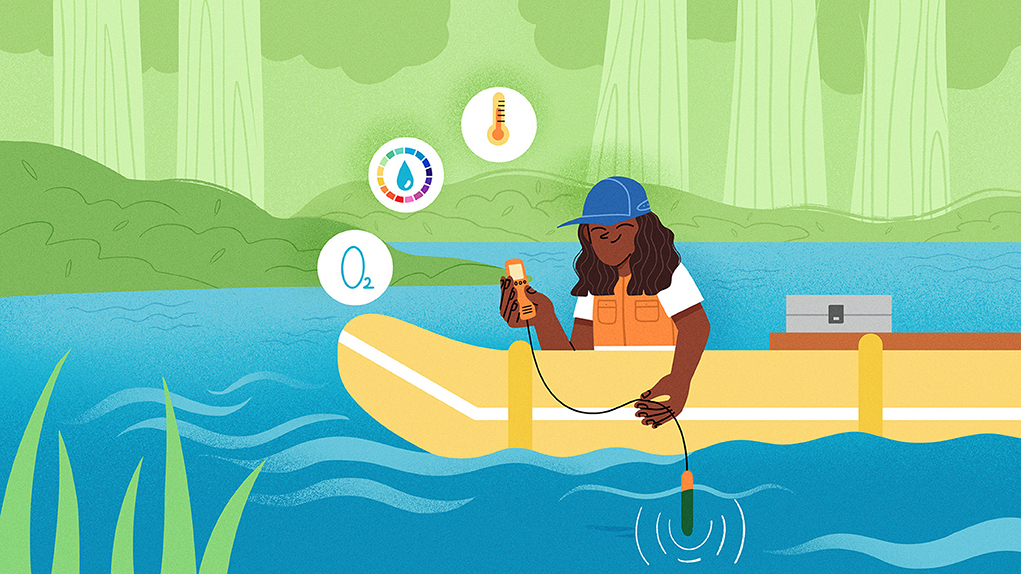
- Figure 1 - Scientists test the water in recreational spaces using various methods, including Secchi disks for turbidity and water clarity, pH and temperature probes and looking at chemical reactions leading to color changes in the samples.
Common Methods for Water Testing
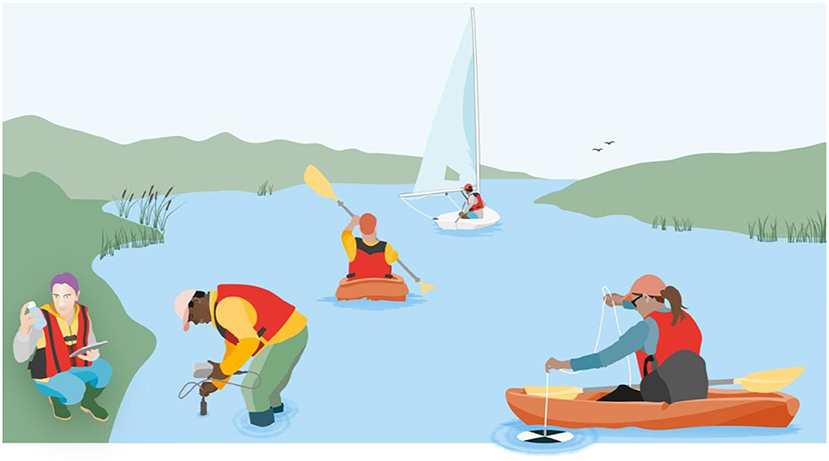
There are some standard methods for water quality analysis, which can help us understand the physical, chemical, and biological properties of water. These methods (described in more detail below) can include handheld digital probes, colourimetric methods, visual observation, and physical filtering (Figures 2A, B). Each method tells a story about what is happening in the water:
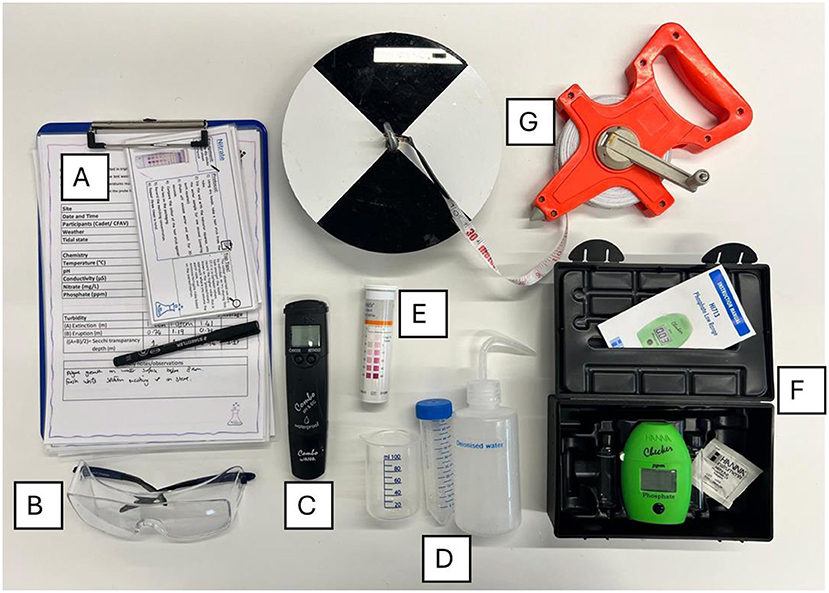
- Figure 2 - Examples of equipment that can be used for water testing: (A) clipboard, data sheet, and pen for observations; (B) safety goggles; (C) pH, conductivity, and temperature probe; (D) tubes and plastic beakers to collect water in; (E) nitrate dipsticks with a colourimetric scale; (F) phosphate meter, instructions, and reaction ingredients; and (G) Secchi disk.
Digital Probes
Handheld digital probes are sensors that can be used to measure a range of different parameters when monitoring water quality, including pH, temperature, electrical conductivity, and dissolved oxygen. The fundamental principle behind this method is the detection of a change in the electrical signal (Figure 2C).
• Temperature is usually measured using a precise digital thermometer. Temperature is an important factor in water chemistry because the temperature is linked to the speed of chemical reactions that can take place in the water. Water temperature also impacts biological processes—for example, animals typically move slower in colder water, particularly fish that rely on external heat to warm their bodies. Digital thermometers measure temperature by detecting heat-sensitive changes in electrical resistance. This is measured by a thermistor, which is a type of electrical resistor where the resistance increases with colder temperatures, this means the current moves slower at colder temperatures and the thermometer can detect this.
• pH is a measure of how acidic or basic the water is, which is important because pH impacts the bioavailability of some chemicals and pollutants. This means different pH levels can affect how likely certain molecules are to interact with living things. pH is determined by measuring the hydrogen ions (H+) in the water that transfer into the probe, causing a change in the electrical current.
• Conductivity is related to how many ions there are in a sample of water. Sea water has high conductivity because it is salty; the salts in the water split into two charged ions (e.g., NaCl [sodium chloride] becomes Na+ and Cl-). When salts become ions in water, this increases their bioavailability and makes them more likely to be involved in other chemical reactions. For example Cl- is free to bind with other ions to make different compounds, such as calcium chloride (CaCl). Conductivity can also tell us about water pollution: if there is a sudden, unexpected increase in conductivity, this could be because of an increase in pollution (or chemicals) in that environment. Similar to pH, conductivity also measures a change in current as a reflection of changing ion concentrations. However, conductivity probes measure more ions than just H+, and they also determine the difference between positively and negatively charged ions.
• Oxygen is really important for plants and animals, even the ones that live underwater. Aquatic animals can get their oxygen from the water in the form of dissolved oxygen. Oxygen dissolves into the water through diffusion and can also be released by water plants that turn CO2 into O2 during photosynthesis. High concentrations of dissolved oxygen are indicators of good environmental quality. Low concentrations can indicate poor water quality, which could be caused by high levels of bacteria that use up the available oxygen [2]. Stagnant or very slow-moving water will often have lower oxygen levels due to the lack of water movement and mixing. Dissolved oxygen meters measure the oxygen in the water that transfers into the probe through a membrane and creates an electric current that is detected by the meter.
Colourimetric Methods
Colourimetric methods of water analysis rely on a chemical reaction that happens if the element is present, which leads to a color change. The reaction can take place on dipsticks where the chemical is imbedded in the testing strip, or can be powders or solutions that are added to water and change color when elements or molecules are detected (Figure 2D). Some are measured by eye, but some can use digital monitors which reduces the need for humans to agree on colors.
Nitrates and phosphates are chemicals that help plants grow, but too much can be bad. Excess nutrients can cause algal blooms—the growth of huge amounts of algae that use up oxygen and make it hard for other plants and animals to live. Nitrates and phosphate are often measured using a handheld device that detects the color change using light, or a color-changing dipstick that can be dipped directly in the water (Figures 2E, F) [3]. Pollution by elements such as copper and iron can also be measured using colourimetric approaches, for example in rivers where water might be running out of old metal mines which can add metal pollution to the water.
Optical Observations
Optical observations are similar to colourimetric observations, but rely on the ability to see a change, or for light to be able to pass through a sample. For example, how cloudy the water is and how much light can shine through the sample which will be impacted by the number of particles in the samples.
Turbidity measures how clear or cloudy the water is. Cloudy water could mean there is pollution, algae, or lots of particles. Cleaner water is usually clearer, but not always—some natural areas are naturally murky, such as estuaries where water movement can stir up sand or sediment. Turbidity can be measured using a turbidity column or a Secchi disk, and both work by using the visual properties of water to score the clarity (Figure 2G). For example, a Secchi disk is lowered into the water until the black and white quadrants are no longer visible. In clearer water, you can see the disk at greater depths compared to water that contains lots of particles (Figure 3).
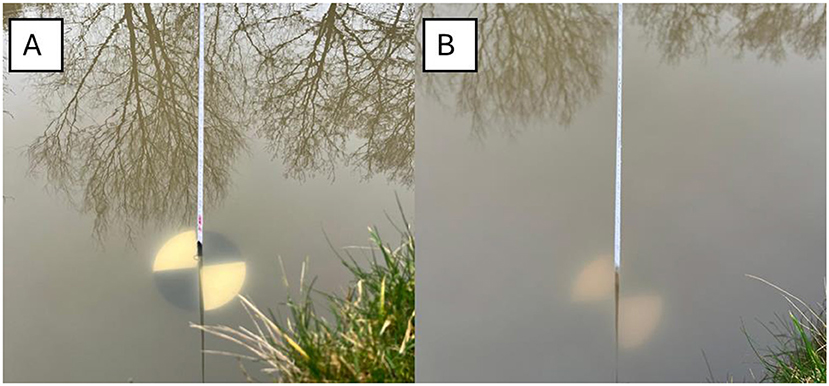
- Figure 3 - A Secchi disk in use.
- (A) The disk is nearer the surface and therefore can be seen more clearly. (B) The disk has been lowered, and the segments are becoming less visible, demonstrating the turbidity of the water. The further the disk can be lowered before the black and white quadrants are no longer visible, the clearer (less turbid) the water.
Physical Monitoring
Physical monitoring uses observations and data from filtering particles from the water, or measuring the flow rate to help us understand how the environment might be changing.
Microplastics are a really common type of pollution that have been found in all environments sampled so far. They are typically defined as pieces of plastics that are less than 5 mm in one dimension. This means they could be 5 mm long but thin like a fiber, or 5 mm wide, such as a sphere or fragment. Microplastics can be found from the tops of mountains to the bottoms of ocean trenches, which demonstrates how far this pollution has traveled. Microplastics in freshwater are often filtered out of water using a net with a fine mesh, around 0.3 mm. Typically, the net is either held in the river for a set amount of time, or a specific volume of water is collected and then poured through the net. While this technique can indicate how much plastic might be in that environment, it is limited to microplastics that are floating in the water—it does not account for any plastic that might be denser and therefore sink into the sediment.
Why do We Need to Monitor the Water?
Keeping track of what is in our water helps us catch problems early. If pollution levels rise, we can figure out where it is coming from and take action before it gets worse. Healthy water is not just for the environment; it is also for us! Clean rivers and lakes mean safer drinking water, healthier wildlife, and better places for swimming, fishing, or just relaxing outdoors [2]. There are many factors that impact the quality of these environments, and when combined they can paint a complex picture of what is going on in the environment. For example, an increase in nitrate levels and turbidity, in combination with a decrease in dissolved oxygen, could be an indicator of poor water quality due to an algal bloom. Monitoring the changes in these environments can be really useful in identifying a problem, and if we do this often enough using a range of good methods, we can catch problems early—before there is more damage or long-term environmental changes [4].
How Can Communities Support Water Protection?
Communities can play a huge role in protecting water. People who live near rivers or lakes often notice changes, like when a stream looks cloudier than usual or smells funny. Reporting these signs can help scientists find and fix problems faster [2]. Water quality can change really quickly for many reasons, and it can be difficult for scientists to monitor a large number of sites. Interested groups, communities, and people can support this monitoring, because collectively they can cover a wider area more frequently than official scientific monitoring can [4].
Getting involved can also be fun! Groups often organize clean-ups or testing events, where you can learn to measure water quality yourself. Spending time outside, whether you are testing water or just enjoying it, is great for your health and happiness, too. Using outdoor spaces for recreational activities is important, so it is in our best interest to monitor these environments to make sure they are safe for human activities—for example, making sure water where people swim does not have harmful algal blooms.
In conclusion, knowing what is in our water is the first step to protecting it. Whether you are a budding scientist or just someone who loves nature, understanding water quality can help you keep our planet healthy and safe for everyone! So, next time you are near a stream or lake, take a closer look—you might just discover something amazing.
Glossary
Digital Probes: ↑ Are electronic sensors that are built into a handheld instrument to detect changes in the environment using methods such as changes to electrical resistance in the water.
Colourimetric: ↑ Describes a method that measures the color, or color change, of something and translates this into a number that can be read by the person measuring.
Conductivity: ↑ Is a measure of the water, or materials, ability to conduct electric currents which is determined by the presence of ions in the material.
Bioavailability: ↑ How easily a substance can be used by living organisms.
Ions: ↑ An atom or molecular that has an overall charge, for example an negative charge if it has extra electrons, or a positive charge if it has extra protons.
Algal Blooms: ↑ Overgrowths of algae that can harm water environments by using up all the oxygen so that other water dwellers do not have enough.
Turbidity: ↑ How clear or cloudy water is, often linked to how much mixing is occurring and how much sediment (particles) is present.
Microplastics: ↑ Are small pieces of plastics, less than 5 mm in one dimension and can be any shape or color.
Conflict of Interest
The authors declare that the research was conducted in the absence of any commercial or financial relationships that could be construed as a potential conflict of interest.
Acknowledgments
NERC Engaged Environments Bursary funded the research that underpinned this work.
AI Tool Statement
The author(s) declare that no Gen AI was used in the creation of this manuscript.
Any alternative text (alt text) provided alongside figures in this article has been generated by Frontiers with the support of artificial intelligence and reasonable efforts have been made to ensure accuracy, including review by the authors wherever possible. If you identify any issues, please contact us.
References
[1] ↑ Reid, A. J., Carlson, A. K., Creed, I. F., Eliason, E. J., Gell, P. A., Johnson, P. T. J., et al. 2019. Emerging threats and persistent conservation challenges for freshwater biodiversity. Biol. Rev. 94:849–73. doi: 10.1111/brv.12480
[2] ↑ Bannatyne, L., Loiselle, S., Simmonds, K., and Woods, S. 2024. The Great UK WaterBlitz. Oxford: Earthwatch Europe.
[3] ↑ Loiselle, S., Bishop, I., Moorhouse, H., Pilat, C., Koelman, E., Nelson, R., et al. 2024. Citizen scientists filling knowledge gaps of phosphate pollution dynamics in rural areas. Environ. Monit. Assess. 196:220. doi: 10.1007/s10661-024-12389-5
[4] ↑ Warner, S., Blanco Ramírez, S., De Vries, S., Marangu, N., Ateba Bessa, H., Toranzo, C., et al. 2024. Empowering citizen scientists to improve water quality: from monitoring to action. Front Water. 6:1367198. doi: 10.3389/frwa.2024.1367198