Abstract
Deep beneath the ocean, giant slabs of rock slide beneath one another in areas called subduction zones. These powerful movements shape the planet by building mountains, creating fiery volcanoes, and even causing huge earthquakes. Scientists study subduction zones to understand why these natural events happen and where and how they might occur so we can be better prepared. One important subduction zone is the Japan Trench, where a big earthquake happened in 2011. To learn more about subduction zones, scientists go on ocean drilling expeditions. They sail on research ships, drill into the seafloor, and collect rock samples. These samples help scientists understand what happened in the past and how subduction zones work. In turn, this information helps communities better understand and prepare for future earthquakes.
The Power of Subduction Zones
Did you know that the outer part of the Earth, where we live, is made of massive slabs of rigid rock that slowly move past each other? These slabs are called tectonic plates, and they fit together like a giant puzzle covering the Earth’s surface (Figure 1A). Some of the plates are continental, carrying the land masses that we live on, whereas others are oceanic and exist under the oceans. In some places, one plate slowly dives beneath a neighboring plate (Figure 1B), creating areas called subduction zones. Subduction zones are mostly found in the ocean. The process of subduction recycles old rock and drives many geological changes, such as building mountains, fueling volcanoes, and sometimes triggering powerful earthquakes and tsunamis.

- Figure 1 - (A) Map showing plate boundaries (gray lines) and subduction zones (red lines).
- The Japan trench is highlighted with a solid red circle. (Map modified from Ref. [1].) (B) A simplified cross section of a subduction zone showing oceanic crust (right side) dives down under the continental crust (left side). As the subducting slab sinks, it causes earthquakes, forms mountains and volcanoes on the continent, and recycles old seafloor back into the Earth.
There are many subduction zones around the world (Figure 1A, red areas), each with unique characteristics based on the age of the subducting plate, how fast it is moving, and how much and what type of sediment (dirt, sand, and rock fragments) is piled up on top of it [2]. These differences affect how frequently earthquakes occur, their potential size, and whether they could cause tsunamis, making each subduction zone an important area for scientists to study. By studying subduction zones, scientists aim to understand how these differences affect earthquakes by comparing the different rock layers underground, the size and type of mineral grains within these rocks and many other physical properties, as well as the pressure, temperature, and chemistry of the water inside them. Scientists can also map where faults and cracks in the rocks called fractures are located and find scars of past earthquakes. This helps reveal the history of earthquakes and tsunamis in these frequently changing regions.
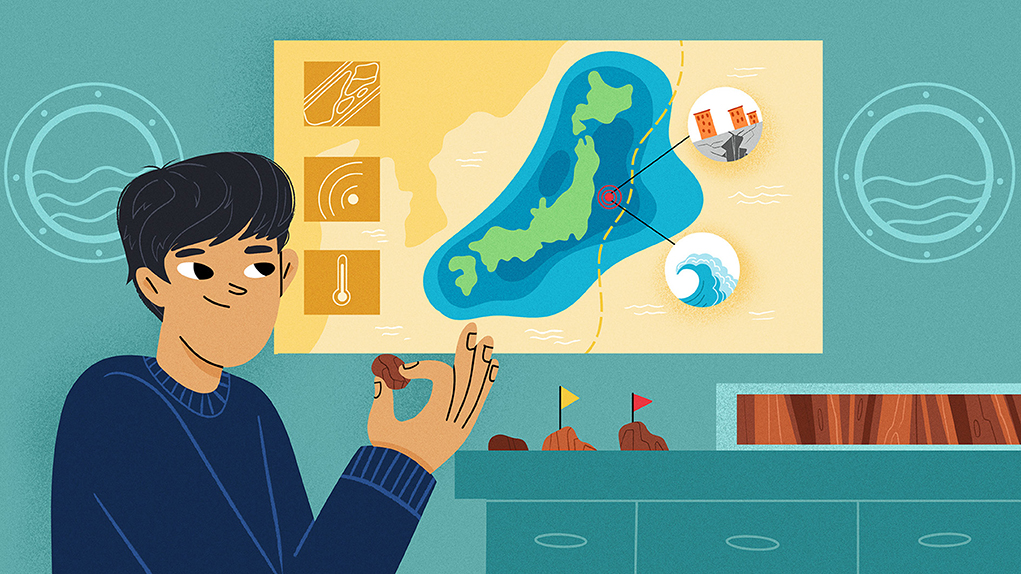
The Japan Trench: A Window into a Subduction Zone
One of the most well-known subduction zones is the Japan Trench (Figure 2A), a deep underwater canyon off Japan’s coast. Here, the Pacific plate moves to the west and sinks beneath the North American plate at a rate of ~8 cm/year [3]. That rate may seem small, but in between earthquakes, the subduction zone is locked. This stops plate movement, leading to a build-up of stress. When this stress is released, it results in earthquakes. You may have heard about the devastating Tohoku-oki earthquake and tsunami that struck Japan in 2011. This earthquake was the 4th largest earthquake ever recorded. That event was a big reminder of the immense power hidden within subduction zones.

- Figure 2 - (A) Map of the Japan Trench.
- International Ocean Discovery Program (IODP) Expedition 405 was conducted at Site C0019 (red circle). The Japan Trench is marked with a white line, and small triangles show the direction of subduction (plate motion). The epicenter of the 2011 Tohoku-oki earthquake is shown with a white star. The bottom-right map shows the location relative to Japan. (B) Chikyu, the scientific drill ship used during Expedition 405. The ship’s height (130 m, ~427 ft) is equivalent to a 30-story building!
Scientists aboard International Ocean Discovery Program (IODP) Expedition 405 (JTRACK: Tracking Tsunamigenic Slip Across the Japan Trench) set out on a mission to study the Japan Trench to answer a key question: why was the Tohoku-oki earthquake so powerful? To collect data that could provide answers to this question, the expedition scientists sailed on the Chikyu (Figure 2B), a remarkable research ship whose name means “Earth” in Japanese. Chikyu is equipped with a huge drill that is ~8 km (~5 mi) long, capable of boring narrow holes (called boreholes) deep into the ocean floor [3]. In addition to being a ship, Chikyu is also a giant floating laboratory, filled with up to 200 scientists, engineers, and technicians who work tirelessly to collect and study samples that are brought back by the drill from deep beneath the seafloor. By drilling into the Earth and collecting rock core samples, the scientists aim to piece together a detailed picture of this subduction zone. They study the different layers of sedimentary and volcanic rocks, looking for clues about past earthquakes, tsunamis, and how this dynamic zone has evolved over millions of years.
Scientific Ocean Drilling: The Tools of Exploration
Scientists study subduction zones in several ways. One method uses seismometers—like powerful microphones—to detect distant earthquakes. They allow researchers to listen for where and how the Earth is shaking deep underground, from far away. However, scientific ocean drilling gives direct access to the subsurface, helping scientists to collect samples and measure conditions beneath the seafloor. Key techniques such as coring, well logging, and borehole observatories help researchers study Earth’s geological history and the forces shaping its surface, offering insights that seismometers alone cannot provide.
Drilling and Coring
To perform coring, scientists lower a powerful drill from the ship to the ocean floor. This drill descends through seawater and penetrates through layers of mud, sand, and rock, collecting and bringing up core samples (Figure 3A). These cores hold so much information, waiting to be deciphered by eager scientists. Geoscientists and technicians work together to collect data on the sedimentology (layering, particle sizes, type of rock, etc.; Figures 3A, B), structure (fractures, folds, veins, etc.; Figure 3C) and other properties (age, magnetic properties, etc.) of the rocks. These data give evidence of past earthquakes and may even contain pieces of the broken fault where two tectonic plates meet.

- Figure 3 - (A) Photograph of the flat face of the core from Hole C0019E, 60–95 cm from the top of core 8R-1, after it was halved.
- (B) X-ray computed tomography (CT) scan for seeing inside the core. (C) Structural interpretation (modified from Ref. [4]). Blue lines: geological faults. Black lines: fractures. Orange dashed lines: sedimentary layers. Interpretations often use multiple data sources to detect subtle color and texture variations. (D) A sampling meeting from Expedition 405. Little flags are planted by the science party members to request samples to carry out further analyses.
When the cores come from the seafloor to the labs on the ship, they are vertically sliced into two halves (Figure 3A). Scientists take samples from one half (the working half)—first on the ship (Figure 3D), and then later back in their labs on land—to perform analyses that help them learn more about the rocks’ properties. The other half (the archive half) is then carefully packed and stored away. These archives are stored in core repositories, where they become a protected record that is very useful for future researchers studying this region. The stored cores are very much like books in a library—able to tell stories of the past to the scientists who know how to read them. Scientists can also access these cores to compare samples from other subduction zones.
Well Logging
Imagine sending a probe down the drill hole, equipped with sensors that can “see” through the rocks! Such well logging tools use a variety of instruments and methods, including actively sending out sound waves and listening to the timing of the echoes. This helps the scientists map variations in rock properties like density, sound speed, temperature, and how much water is inside the rocks and sediments. These measurements allow scientists understand rock types and to image the subduction zone’s hidden structures. Some logging tools can even do a 360° scan of the borehole based on changes in the electrical resistance of the rocks surrounding the borehole, similar to taking a panoramic picture of the borehole.
Borehole Observatory
Sometimes scientists put sensors in the drilled holes and leave them there for a long time. These sensors, called a borehole observatory, record data for the entire time they are underground, tracking small changes in temperature and pressure over the course of several months or even years. These data tell us about the plate boundary fault’s behavior over longer time scales. For instance, if the study area is shaken by nearby earthquakes during the data collection period, a borehole observatory can tell us about the tiny temperature changes that happen within the fault, including where and when underground springs of water may be flowing through faults and fractures [5]. These data can tell us how the fault zone might be changing by providing clues about the fault’s stress conditions and the permeability.
Unraveling Earth’s Past, Shaping Our Future
The study of subduction zones extends far beyond the field of geology, offering critical insights into some of the most powerful natural disasters on Earth. These regions, where one tectonic plate slides beneath another—such as the Japan Trench—are responsible for generating the world’s most intense earthquakes. Understanding the conditions that lead to such events is essential for improving disaster preparedness and limiting the earthquake damage. By analyzing the physical and chemical properties of fault zones, as well as the stress and pressure conditions within subduction zones, scientists can refine computer models that can predict when and where earthquakes might occur and assess how likely they are to trigger large tsunamis. This knowledge supports the development of early warning systems, evacuation plans, and safer building designs, helping communities around the world prepare for future seismic events.
Beyond contributing to better understanding of earthquake hazards, the study of subduction zones contributes to a broader understanding of Earth’s complex systems. Tectonic plate movements shape the planet’s surface, creating mountain ranges, deep-sea trenches, and volcanic activity. Investigating subduction processes helps scientists uncover the forces driving these dynamic changes in some of the most geologically active regions on Earth.
The deep ocean remains one of Earth’s least explored frontiers, yet it holds the key to understanding the forces that shape the planet. So, the next time you gaze out at the ocean, remember the hidden wonders that lie beneath the waves! Scientific ocean drilling, with missions like Expedition 405, is bringing those wonders to light. By studying faults and the way the Earth moves, scientists are learning how to better understand and prepare for natural events like earthquakes and tsunamis, helping to make our planet a little safer.
Glossary
Tsunami: ↑ A giant wave caused by something like an underwater earthquake or a volcano. It starts small in the deep ocean but gets really big and powerful as it reaches the shore.
Fault: ↑ A crack in the Earth’s crust where blocks of rock can move past each other. Faults are places where earthquakes often happen.
Stress: ↑ Geologic stress is like when you press, pull, or squeeze a rock really hard. Over time, this pressure can make the rock bend, crack, or even break.
Core: ↑ A long cylinder of rock that we pull out of the ground. It contains whatever layers of rock are present deep underground.
Well Logging: ↑ Keeping a detailed record of the types of rocks, fluids, and other properties found in the ground as a hole is drilled.
Permeability: ↑ Measure of how easily fluids move through rocks or sediments. High permeability allows liquids to flow freely, like in sand, while low permeability restricts flow, like in clay or solid rock.
Conflict of Interest
The author(s) declared that this work was conducted in the absence of any commercial or financial relationships that could be construed as a potential conflict of interest.
Acknowledgments
Written informed consent was obtained from the individual(s) for the publication of any identifiable images or data included in this article. This work was funded by the Jackson School of Geosciences at The University of Texas at Austin. Expedition 405, the final expedition carried out by the International Ocean Discovery Program (IODP), was funded by the Japan Agency for Marine-Earth Science and Technology (JAMSTEC), the U.S. National Science Foundation (NSF), the U.S. Science Support Program (USSSP), the European Consortium for Ocean Research Drilling (ECORD), and the Australian and New Zealand International Scientific Drilling Consortium (ANZIC). In addition to the co-chiefs, Expedition 405 Science Party also includes Piero Bellanova (RWTH Aachen University), Cameron Brown (University of California Los Angeles), Morgane Brunet (IFREMER), Marissa Castillo (The Ohio State University), Yu-Chun Chang (JAMSTEC), Mai-Linh Doan (Université Grenoble Alpes), Jenna Everard (Columbia University), Alysa Fintel (University of Washington), Jonathan Ford (Istituto Nazionale di Oceanografia e di Geosifica Sperimentale), Rina Fukuchi (Naruto University of Education), Amy Gough (Heriot-Watt University), Huiyun Guo (University of California Santa Cruz), Derya Gürer (Heidelberg University), Ron Hackney (The Australian National University), Minori Hagino (Yamagata University), Yohei Hamada (JAMSTEC), Hinako Hosono (Geological Survey of Japan/AIST), Akira Ijiri (Kobe University), Matt Ikari (MARUM, University of Bremen), Tsuyoshi Ishikawa (JAMSTEC), Masao Iwai (MaCRI, Kochi University), Tamara Jeppson (U.S. Geological Survey), Maria Jose Jurado (Geosciences Barcelona CSIC), Nana Kamiya (Kyoto University), Toshiya Kanamatsu (JAMSTEC), Aubrey LaPlante (Northern Arizona University), Weiren Lin (Kyoto University), Ayumu Miyakawa (Geological Survey of Japan/AIST), YukiMorono (JAMSTEC), Rena Murata (JAMSTEC), Yasuyuki Nakamura (JAMSTEC), Uisdean Nicholson (Heriot-Watt University), Hanaya Okuda (JAMSTEC), Pei Pei (Université Grenoble Alpes), Charlotte Pizer (University of Innsbruck), Troy Rasbury (Stony Brook University), Rebecca Robertson (Durham University), Catherine Ross (University of Colorado Boulder), Sara Satolli (University of Chieti-Pescara), Heather Savage (University of California Santa Cruz), Kaitlin Schaible (University of Texas at Austin), Srisharan Shreedharan (Utah State University), Hiroki Sone (University of Wisconsin Madison), Chijun Sun (University of California Davis), Cédric Turel (UMR Géoazur), Taizo Uchida (Kochi University), Paola Vannucchi (University of Florence), Asuka Yamaguchi (Atmosphere and Ocean Research Institute, The University of Tokyo), Yuzuru Yamamoto (Kobe University), Takeru Yoshimoto (Kobe University), Junli Zhang (MARUM, University of Bremen). We thank the Science Party for their efforts to make Expedition a success.
AI Tool Statement
The author(s) declared that generative AI was not used in the creation of this manuscript.
Any alternative text (alt text) provided alongside figures in this article has been generated by Frontiers with the support of artificial intelligence and reasonable efforts have been made to ensure accuracy, including review by the authors wherever possible. If you identify any issues, please contact us.
References
[1] ↑ Bird, P. 2003. An updated digital model of plate boundaries. Geochem. Geophys. Geosys. 4, 1027. doi: 10.1029/2001GC000252
[2] ↑ Stern, R. J. 2002. Subduction zones. Rev. Geophys. 40, 1–13. doi: 10.1029/2001RG000108
[3] ↑ Kodaira, S., Conin, M., Fulton, P., Kirkpatrick, J., Regalla, C., Ujiie, K., et al. 2023. Expedition 405 scientific prospectus: tracking Tsunamigenic Slip Across the Japan Trench (JTRACK). Int. Ocean Discov. Program. doi: 10.14379/iodp.sp.405.2023
[4] ↑ Chester, F. M., Mori, J. J., Eguchi, N., Toczko, S., and Expedition 343/343T Scientists. 2013. Proceed. Integ. Ocean Drilling Prog. 343/343T. Tokyo: Integrated Ocean Drilling Program Management International, Inc. doi: 10.2204/iodp.proc.343343T.2013
[5] ↑ Fulton, P. M., and Brodsky, E. E. 2016. In situ observations of earthquake-driven fluid pulses within the Japan Trench plate boundary fault zone. Geol. 44, 851–4. doi: 10.1130/G38034.1