Abstract
Did you know you make an average of 35,000 decisions each day? Some of these choices are relatively unimportant, like deciding what to eat for breakfast. But others have a greater impact on your future, like choosing which university to attend. When faced with a difficult decision, how do you consider every option to pick the best one? The analytic hierarchy process is one method you can use. It helps you make hard decisions by comparing multiple alternatives to make the best choice.
What is the Analytic Hierarchy Process?
How do you make complex decisions with no obvious best answer? Imagine you need to purchase a new bike. Bike A is cheaper than Bike B, but Bike B has a lot more features than Bike A. Which is the more important criterion to you—cost or features? Or maybe something else? We sometimes make decisions by following our gut instincts or relying on past experiences. We may also seek others’ advice or make a list of pros and cons. Another method that could help you process all the information and make your decision is called the analytic hierarchy process (AHP). A hierarchy is a system of ranking different options against each other based on importance.
The AHP is particularly helpful when you are making a decision with no clear best choice. Maybe there are more criteria involved in the decision—not just two as in the bike example. The AHP combines math and psychology to compare several options and select the best one [1]. It does this by using a concept called pairwise comparisons. Instead of comparing several criteria at once, they are compared two at a time. That way, the choice is easier to make.
Linear algebra is a type of math that helps us calculate the importance of criteria using matrices. The AHP uses linear algebra to assess the results of each pairwise comparison. Every criterion receives its own importance weight. The higher the weight, the more important the criterion is to the overall decision. This method of comparison can be applied to many decisions. For example, you can use it to select a product or service, like a car or airline flight. You can also use it to choose the most efficient process or route, such as evaluating whether to use private or public transit to get to school [2].
The AHP is used daily in manufacturing, business, engineering, and other industries. For example, it can be used to prioritize the maintenance of publicly used structures, like bridges [3]. There are currently 56,000 bridges in the United States in need of repair. These repairs would cost a total of $123 billion. However, there is not enough money in the budget to fix every bridge. So, engineers used the AHP to develop a bridge rating system. This rating system decides which bridges to maintain, given a limited budget. The system considers each bridge’s safety, use, riding comfort, and ability to withstand damage.
The engineers used pairwise comparisons to weigh and compare four criteria for 2,988 U.S. bridges. Based on the four criteria, each bridge received an overall rating, from “excellent” to “failing.” The engineers found that none of the bridges they evaluated were rated above “good.” In fact, 75% of all bridges in their study were just “satisfactory”—or worse! The ratings draw attention to problems with our country’s infrastructure and could result in more money for maintenance and repair. The ratings also tell us which bridges need to be fixed first. This decision of which bridge to repair could even save lives!
How Do We Use the Analytic Hierarchy Process?
The AHP consists of four steps:
(1) Identify the decision, options, and criteria.
(2) Conduct pairwise comparisons.
(3) Calculate the importance weight of each criterion.
(4) Identify the best option by calculating something called utility.
Decision, Options, and Criteria
Every decision begins with a question: which alternative is right for you? For example, you can use the AHP to select which university to attend. In this scenario, you may want to decide which of your top three options (Universities A, B, or C) is best for you. Once you understand the question and the options, you then decide which criteria to consider. Perhaps the three most important criteria for you are finding a school that is affordable, located close to home, and well-ranked. Once you identify these criteria, you can begin the process of pairwise comparisons.
Pairwise Comparisons
The important criteria that you identified are then organized into matrices. A matrix is a grid with information arranged in rows and columns. In AHP matrices, each criterion has its own row and column. The resulting square matrices allow pairwise comparison of all possible combinations of criteria (Figure 1).
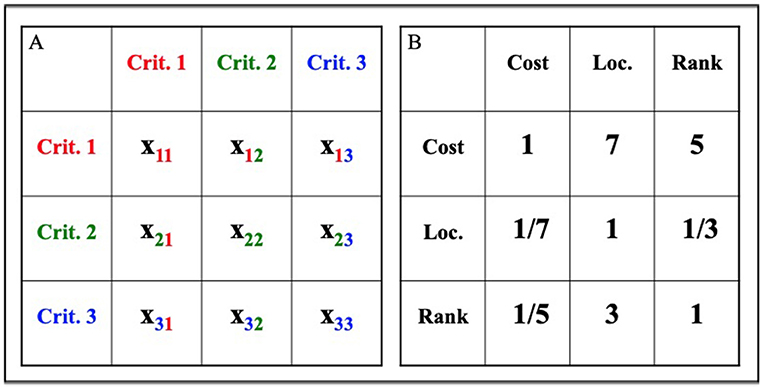
- Figure 1 - Sample AHP matrices.
- (A) Matrix A is a 3 × 3 example matrix. It shows how pairwise comparisons are organized and referenced using subscripts: for example, x12 refers to the grid space in the first row, second column. (B) Matrix B is also a 3 × 3 matrix. It contains the three criteria in our university decision: cost, location, and rank. In this example, each grid space contains a score from the pairwise comparisons. These sample scores show that cost is the most important decision factor, followed by academic rank and lastly, location.
The first step of pairwise comparisons is to assign a number to each grid space. This number is the relative importance of the two criteria. For example, a score of 1 means both criteria are equally important. When a criterion is compared to itself, its relative importance is 1, because the criteria being compared are the same. Larger numbers show a criterion is increasingly more important, with 9 being the highest score [1]. In row 1 of Figure 1B, cost is seven times as important as important (x12 = 7) to the final decision as location and five times as important (x13 = 5) as academic rank. This scoring process is repeated for all of the grid spaces to the right of the diagonal (the upper right half of the matrix).
Because cost is seven times as important as location, we can also say that location is 1/7 as important as cost (x21). Similarly, since cost is five times as important as academic rank, rank must be 1/5 as important as cost (x31). This process of using reciprocals, or inverses (1/x), to describe the opposite relationship between two criteria is repeated for all of the grid spaces to the left of the diagonal (the lower left half of the matrix). If criterion 1 is x times as important as criterion 2, then criterion 2 must be 1/x as important as criterion 1.
Importance Weights
The completed matrix is then used to calculate importance weights, which tell you how much each criterion will factor into your decision. The higher the importance weight of a given criterion, the more influence it will have on your final decision. This part of the AHP relies on linear algebra. The first step to determine the weight of a criterion is to find the geometric mean (V) of the row. The geometric mean is a type of average. You can find the geometric mean by multiplying all the relative importance scores from the row (x) and taking the nth root of this product (where n = total number of criteria). It is better to use the geometric mean than the arithmetic mean (sum/n) for this type of calculation [4]. This sample equation shows you how to calculate the geometric mean of Criterion 1 of the 3 × 3 generic matrix (Figure 1A):
Next, divide the criterion’s geometric mean by the sum of the geometric means of all the criteria. The resulting decimal is the weight (W) of that criterion. This method is called normalization, because it ensures the sum of all weights equals 1, or 100%. The weights sum to 1 because each criterion accounts for a portion of the entire decision. This sample equation shows you how to calculate the weight of Criterion 1 of the 3 × 3 generic matrix (Figure 1A):
What happens if we do the same calculations for the criterion of cost, using the relative importance scores from Figure 1B?
This tells us cost accounts for 73% of the overall decision of which university to attend. Using this same method, we find that the calculated weight for location is 8% and rank is 19%.
Utility: Which is the Best Option?
The final step of the AHP is to determine utility. Utility is a numerical value providing information on how useful something is to you, and it will help you to select the best option. The more beneficial or useful a criterion is, the higher its utility. Utility may be measured differently for each criterion. In our example, affordability is measured in dollars. Location is measured in miles from home. Academic ranking is given a score, where #1 represents the top-ranked (first-place) school and higher numbers correspond to less prestigious universities. When criteria have different units, we must first convert them into standardized units called utiles (a unitless measure of utility) using graphs called utility functions. In Figure 2, you can see how we use utility functions in the university decision. Total utility considers the utility of each individual criterion and its importance to the overall decision. Total utility equals the sum of the products of each criterion’s weight and respective utility value:
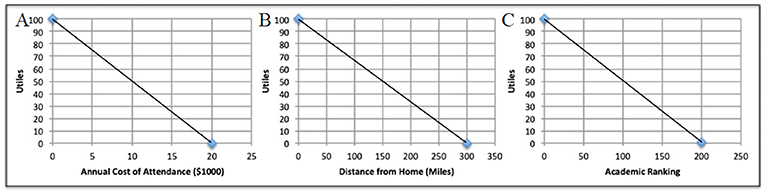
- Figure 2 - Sample utility functions for the university decision process.
- For affordability, a school with free tuition has the maximum possible utility: 100 utiles. If tuition exceeds your budget of $20,000 per year, it has the minimum possible utility: 0 utiles. For location, if your goal is to be close to home, a school 0 miles away earns 100 utiles. A school more than 300 miles away earns 0 utiles. For academic rank, the top-ranked (#1) school earns 100 utiles. A school that failed to make the top 200 earns 0 utiles. (A) Cost utility. (B) Location utility. (C) Rank utility.
Once all three criteria are measured, the total utility of each option is found. A sample utility calculation for University A is:
Using this same method, we find the total utility data for Universities B and C, shown in Table 1.
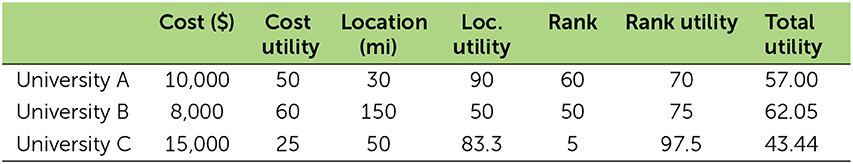
- Table 1 - Sample University data.
- Example costs, locations, and rankings are given. The cost, location, and rank utility values (in utiles) are from the utility functions in Figure 2. These values were plugged into the utility function to calculate total utility. Each university’s total utility is seen in the rightmost column.
Based on the results of the AHP, University B is the best choice. As seen in Table 1, University B has the highest total utility, 62.05. This is because it is the most affordable option, and cost accounts for 73% of the overall decision. Thanks to its great location, University A is a close second, with a total utility of 57.00. Even though University C is the highest-ranked school, it has a much lower total utility (43.44) than the other two due to its high cost, so it is the worst choice.
Summary
The AHP is a powerful tool that can be used at home, at school, or at work. It removes bias from the decision-making process and ensures the decision you make reflects your values and priorities. The next time you are faced with a difficult decision, consider using the AHP to make your choice. The possibilities are endless—the AHP is limited only by your creativity in applying it.
Glossary
Analytic Hierarchy Process: ↑ A decision making method that compares multiple alternatives, each with several criteria to help select the best option.
Pairwise Comparison: ↑ The process of comparing criteria two at a time.
Linear Algebra: ↑ A branch of mathematics that concerns linear functions, vector spaces, and matrices.
Utility: ↑ A numerical representation of how useful or beneficial something is to you.
Matrix: ↑ A grid with information, such as numbers, letters, and symbols arranged in rows and columns.
Geometric Mean: ↑ The average value of a set of numbers found by using the product of their values, rather than the sum.
Utile: ↑ A unitless measure of utility used to standardize the units of different criteria.
Conflict of Interest
The authors declare that the research was conducted in the absence of any commercial or financial relationships that could be construed as a potential conflict of interest.
References
[1] ↑ Ishizaka, A., and Labib, A. 2011. Review of the main developments in the analytic hierarchy process. Expert Syst. Appl. 38:14336–45. doi: 10.1016/j.eswa.2011.04.143
[2] ↑ Ho, W., and Ma, X. 2018. The state-of-the-art integrations and applications of the analytic hierarchy process. Eur. J. Oper. Res. 267:399–414. doi: 10.1016/j.ejor.2017.09.007
[3] ↑ Contreras-Nieto, C., Shan, Y., Lewis, P., and Hartell, J. A. 2019. Bridge maintenance prioritization using analytic hierarchy process and fusion tables. Autom. Construct. 101:99–110. doi: 10.1016/j.autcon.2019.01.016
[4] ↑ Krejˇcí, J., and Stoklasa, J. 2018. Aggregation in the analytic hierarchy process: why weighted geometric mean should be used instead of weighted arithmetic mean. Expert Syst. Appl. 114:97–106. doi: 10.1016/j.eswa.2018.06.060