Abstract
Surprisingly, most species on Earth are rare, meaning that they exist in small numbers, and only a few are common, meaning that they are abundant and widespread. Monitoring rare species is very important because they are more vulnerable to environmental disturbances. In addition, many rare species may have unique functions in ecosystems, that we still do not understand well. Scientists need tools to tell how species rarity changes over time and across large areas. We developed an application called FuzzyQ (which stands for Fuzzy Quantification of common and rare species in ecological communities) to do that. FuzzyQ examines how individuals of each species are distributed and provides a measurement of the rarity of each species. With FuzzyQ, we can monitor how the rarity of species changes over time or across large geographical areas. So, FuzzyQ can supply crucial information for the conservation of rare species.
Finding Regularities in an Irregular World
Ecology is a field that involves studying how living things interact with each other and with their environments. We need ecology to understand the way nature works. The study of ecology also helps us to produce healthy food, maintain clean air and water, and sustain biodiversity, which is the variety of life on Earth. Ecologists strive to find regular patterns in the data they collect from nature, so that they can understand nature better. A better understanding of nature helps scientists to make more accurate predictions about the impact of threats to biodiversity (such as climate change). Finding regular patterns is not easy because environments differ, and organisms are amazingly diverse. So patterns are like hidden treasures for ecologists. However, one of the patterns that we find over and over again in nature is that, in any ecological community, most species are rare, meaning that they exist in small numbers, while a few species are common, meaning that they are abundant and widespread (Figure 1) [1].

- Figure 1 - Example of a fish community.
- A few species are common, meaning there are lots of individuals of that species present in the community, and most species are rare, meaning there are few of them present in the community. Can you tell how many species are common and how many are rare in this image? (Image credit: freepik.com).
Why are Rare Species Important?
So, somewhat surprisingly, it seems that most species on Earth are rare! Should we care about those rare species? The answer is yes! Small, rare populations are more sensitive to environmental disturbances, like fires, flooding or pest outbreaks so rare species are at higher risk of extinction. We need to monitor rare species closely to ensure that their populations remain healthy. Keeping track of the changes in populations of rare species over time or across geographic areas is important because it will help us better evaluate the effects that environmental changes might have on ecosystems. In addition, we know that species play specific functions in ecosystems. For instance, pollinator insects make the reproduction of many plants possible. Likewise, plants growing on wetlands protect the land against floods and storms. Rare species may be responsible for unique functions. So, their extinction could have a big impact on their ecosystem.
What Makes a Species Common or Rare?
Since rare species are so important, we need ways to tell how rare a species is. This may seem easy, but ecologists have argued about it for years. There still is not 100% agreement on the characteristics that make a species rare. However, two properties are usually involved: occupancy and abundance [2]. Imagine we survey an ecological community over several sites (called quadrats). Rare species should show both low abundance (few individuals in the entire area) and low occupancy (few sites occupied) (Figure 2). So, we attempted to classify species based on these features. However, we felt that classifying species simply as “rare” and “common” did not give us enough information to grasp how ecological communities are organized. Look, for example, at species c in Figure 2B. It was classified as rare, but it falls quite far from the rest of the rare species on the graph, does not it? We need to take the actual numbers into account to understand how rare a rare species is. Science works best with things that can be measured as numbers.
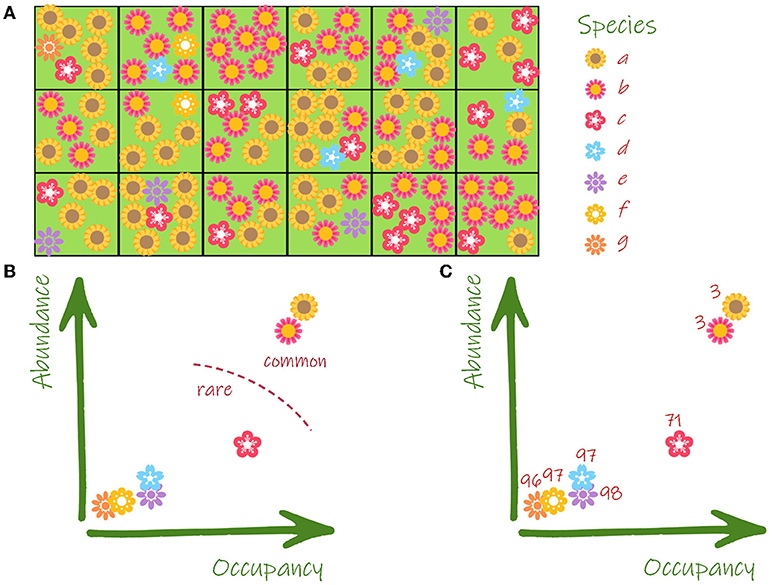
- Figure 2 - (A) To survey plant species (a to g), we divided the study area in 18 quadrats.
- Then we determined the number of quadrats occupied by each species (occupancy) and the total number of individuals of each species in the entire area (abundance). (B) Plot of occupancy and abundance of each species, based on the data from the 18 quadrats. A math technique called hard clustering was used to distinguish common from rare species. (C) Plot showing the results of another math technique called fuzzy clustering. The numbers indicate the percentage of rarity of each species (Image credit: freepik.com).
Looking at the Numbers
Mathematicians have developed methods to group things using complicated equations, which are called clustering techniques [3]. There are two types: hard clustering and fuzzy clustering. In Figure 2B, we used a hard clustering technique with the occupancy and abundance data. Hard clustering assigns each item to one—and only one—of the categories considered. So, each species is either common or rare. In Figure 2C, we applied fuzzy clustering to the same data. In fuzzy clustering, each species is common and rare at the same time, but in different proportions. For example, species c is 71% rare and 29% common. All the other rare species are over 95% rare. So, we can say that c is rare, but d, e, f, and g are rarer than c.
Our Brainchild
These ideas lead us to develop our own computer application to characterize ecological communities. We called it FuzzyQ, which stands for “fuzzy quantification of common and rare species in ecological communities.” We wrote it in a programming language called R. We chose R because it is a free software for statistics and graphics that anyone can use [4].
In addition to performing a fuzzy clustering of species, FuzzyQ does other cool things. For instance, it computes numbers called silhouettes (Figure 3). Silhouettes measure how well each species matches its own cluster (formed by either rare or common species). Values close to one indicate a good fit of the species to its own cluster. In Figure 3B2, two rare species (indicated with arrows) show low silhouettes because they had low abundance but fairly large occupancy (Figure 3B1). So, they are not as well-separated from the common species as the other rare species are. Overall, the silhouettes of the community in Figure 3A2 show a clearer separation between common and rare species than the community studied in Figure 3B2.
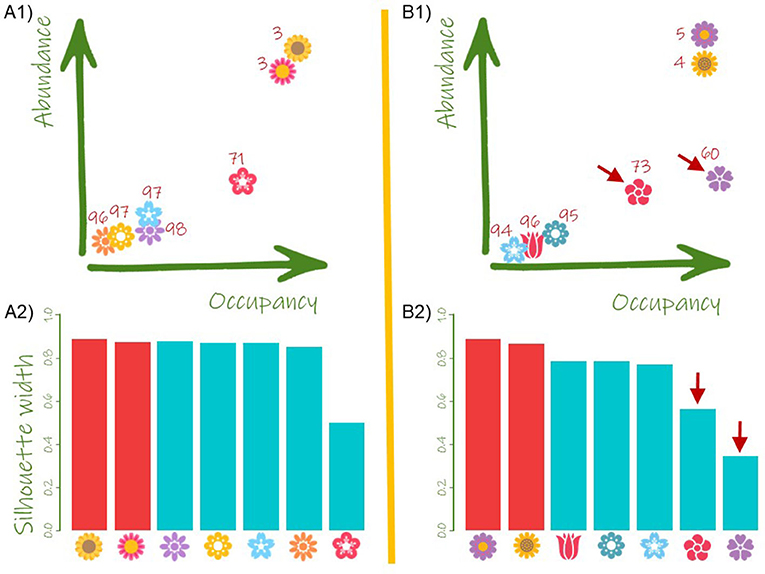
- Figure 3 - Silhouette plots are used to compare communities.
- (A1) Plot of abundance and occupancy of the plant community studied in Figure 2 and (A2) its respective silhouette bar plot. (B1) Plot of abundance and occupancy of a different community of plants and (B2) its respective silhouette plot. The numbers in (A1,B1) indicate the percentage (%) of rarity of each species. Silhouette plots are another way to show how common (red) or rare (blue) species are in each community. The arrows point to two rare species with high occupancy, which accounts for low silhouette values (Image credit: freepik.com).
Silhouette plots allow us to easily compare communities, even if the species in each community are different. Using silhouette plots, we can compare environmental changes over very large areas. For example, birds in a savannah in Africa are quite different from birds in a meadow in Europe, but we can compare the two bird communities using the species silhouettes by observing how common and rare species separate in each community.
FuzzyQ Can Help Preserve Rare Species
Major threats to biodiversity, such as global warming and takeover by invasive species [5], are important to study because they can disrupt ecological communities. Rare species are especially vulnerable to environmental changes. FuzzyQ can supply crucial information on how changes that happen within ecosystems can affect rare species. This application provides a simple way to monitor variation in species rarity over time or across large areas. In addition, it is simple to use and free. So, FuzzyQ can be a very valuable tool for scientists to help conserve rare species and protect Earth’s ecosystems from the effects of environmental disturbances.
Funding
This study was funded by the Ministry of Science and Innovation, Spain (PID2019-104908GB-I00). VS was supported by the Polish National Agency for Academic Exchange (PPN/ULM/2019/1/00177/U/00001). CL-B acknowledges the support of an ETH Zürich Postdoctoral Fellowship (20-2 FEL-67).
Glossary
Biodiversity: ↑ The variety of life on Earth. Biodiversity includes the variety of genes, the variety of species, and the variety of ecosystems.
Ecological Community: ↑ The various populations that interact with one another in an area. For example, a pond community contains fish, plants, shrimps, frogs, insects, and many other tiny organisms.
Population: ↑ All individuals of the same species living in an area. For example, all gorillas living in the same forest form a population.
Occupancy: ↑ Number or proportion of sites where a species occurs.
Abundance: ↑ The total number of individuals of a species in an area.
Hard Clustering: ↑ Statistical technique to group things that assigns each thing to one group and only one group.
Fuzzy Clustering: ↑ Statistical technique to group things that assigns each thing to more than one group in different proportions.
Invasive Species: ↑ A species that is moved from its native area, where it grew naturally, into a new area where it usually causes harm to the species of the new area.
Conflict of Interest
The authors declare that the research was conducted in the absence of any commercial or financial relationships that could be construed as a potential conflict of interest.
Original Source Article
↑Balbuena, J. A., Monlleó-Borrull, C., Llopis-Belenguer, C., Blasco-Costa, I., Sarabeev, V. L., and Morand, S. 2021. Fuzzy quantification of common and rare species in ecological communities (FuzzyQ). Methods Ecol. Evol. 12:1070–9. doi: 10.1111/2041-210X.13588
References
[1] ↑ Magurran, A. E., and Henderson, P. A. 2011. “Commonness and rarity,” in Biological Diversity: Frontiers in Measurement and Assessment, eds A. E. Magurran, and B. J. McGill (Oxford: Oxford University Press), pp. 97–104.
[2] ↑ Gaston, K. J., and He, F. 2011. “Species occurrence and occupancy,” in Biological Diversity: Frontiers in Measurement and Assessment, eds A. E. Magurran, and B. J. McGill (Oxford: Oxford University Press), pp. 141–51.
[3] ↑ Kaufman, L., and Rousseeuw, P. J. 1990. Finding Groups in Data: An Introduction to Cluster Analysis. New York, NY: John Wiley & Sons..
[4] ↑ Phillips, N. D. 2018. YaRrr! The Pirate’s Guide to R. Available online at: https://bookdown.org/ndphillips/YaRrr/
[5] ↑ Morais, P., Encarnação, J., Teodósio, M.A., and Dias, E. 2021. Aliens from an underwater world. Front. Young Minds. 9:646539. doi: 10.3389/frym.2021.646539