
Abstract
Computer models are an important tool that we can use to learn about the San Francisco Estuary. The San Francisco Estuary is a complex environment where salty water from the Pacific Ocean mixes with freshwater from rivers, because of tides, wind, and waves. These physical processes can be described using mathematical equations, which can be solved using computers. Using these equations to represent conditions in the San Francisco Estuary and solving them is called hydrodynamic modeling. Modeling of conditions in the Estuary requires an understanding of physics, mathematics, and computer science, which are combined to help us learn about the processes and environments in the Estuary. Models can be used to predict flooding and to design levees. They can also be used to help us improve how we manage the Estuary to provide a reliable water supply and to protect habitats for plants and animals.
Introduction
Every day, tides move saltwater from the Pacific Ocean in and out of the San Francisco Estuary (California, USA) through the Golden Gate. Estuaries are complex environments where saltwater from the ocean mixes with freshwater from rivers because of tides, wind, and waves (Figure 1) [1]. Two large rivers and several smaller ones join to form the Sacramento-San Joaquin Delta (the Delta) at the upstream end of the San Francisco Estuary (the Estuary). Many smaller streams and rivers flow directly into the Estuary. The Estuary provides nearby farms with the water needed to grow crops and it also serves as a source of drinking water for millions of people. In addition, the Estuary provides important habitats for many species of birds, fish, and other animals.
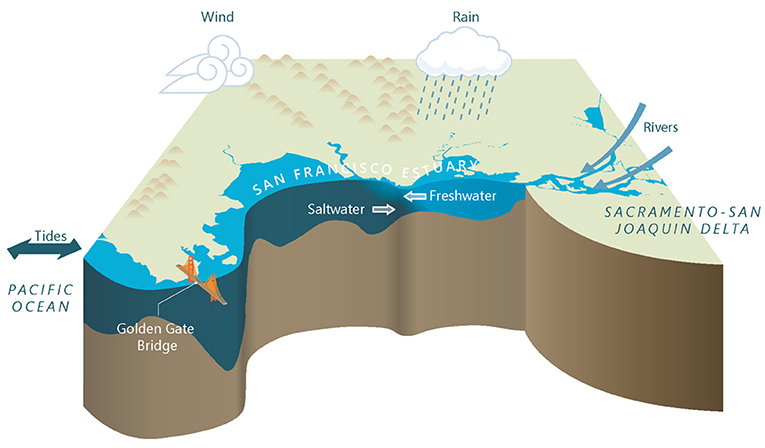
- Figure 1 - Profile of the San Francisco Estuary from the Pacific Ocean to the Sacramento-San Joaquin Delta.
- Denser saltwater from the Pacific Ocean moves in and out of the Estuary with the tides and flows landward, under the fresher surface water from rivers and rainfall. The freshwater and saltwater are mixed in the Estuary because of tides, wind, and waves.
One way to study the complicated environment of the Estuary is to use computer models. Building computer models of natural ecosystems like the Estuary requires an understanding of physics, mathematics, and computer science [2]. Equations can be used to describe the physical processes that control the flow of fluids, such as air or water. These equations can be solved using computers, to predict things like how air flows around the wings of an airplane, or how water moves in and out of the Estuary because of tides. By solving these equations, we can evaluate whether an airplane will fly, or how water flow, salinity, and habitats in the Estuary may change in the future. We can use computer models of the Estuary to understand the effects of building a new harbor or restoring a wetland. We can also use these models to plan for future changes to the Estuary that result from climate change or sea-level rise.
Recipe for an Estuary
The most easily observable feature of the San Francisco Estuary is the twice-daily rise and fall of the water levels by as much as 2 meters because of the tides. Tides in the Estuary are caused by the earth’s rotation and the gravitational pull of the moon and sun on the Pacific Ocean. When the water level in the ocean rises, water floods into the Estuary through the Golden Gate. When the water level falls, water ebbs back out into the ocean. These ebb and flood currents can be quite strong, up to 2 meters per second under the Golden Gate Bridge. Each day, as much as 3.5 billion cubic meters of water move in and out of the Estuary due to tides. That is enough water to fill 1.4 million Olympic-size swimming pools. Tidal currents mix whatever is in the water and they also erode sediments on the bottom of the Estuary.
Strong winds also blow over the surface of the Estuary. These winds drive currents and generate surface waves. Wind-driven currents and waves are much stronger and more important in the large, shallow areas of the Estuary. Like tidal currents, wind-generated waves also are important for sediment erosion.
While tides and surface waves are clearly visible, an equally important feature is one that is not so easily seen. Because freshwater from rivers is lighter (less dense) than saltwater, fresh river water tends to float on top of the salty ocean water as it makes its way seaward, out to the ocean. As the water moves back and forth with the tides, the denser ocean water flows landward, under the fresher surface water. The circulation of water caused by the seaward currents at the water surface and the landward currents near the bottom is called gravitational circulation. The density-driven currents that cause gravitational circulation are generally weaker than tidal currents. Over time, however, gravitational circulation moves salt upstream into the Delta, the freshwater part of the Estuary. This is known as salinity intrusion. If the water in the Delta becomes too salty, it can no longer be used for drinking or watering crops. As a result, one of the most important uses of computer models of the Estuary is to predict how far salt will intrude into the freshwater reaches of the Estuary.
Computer Modeling
Before computers were as fast as they are today, physical models were built to understand how water flows in the Estuary. These physical models look like swimming pools but are shaped like small versions of the Estuary. They have pumps to make tides and are filled with salty water on the “ocean” side. The United States Army Corps of Engineers still operates a physical model of the Estuary for educational purposes. Today, using modern computers, it is possible to simulate flows in the Estuary more easily and accurately than with a physical model. Computers can solve the complicated mathematical equations that show how water responds to tides, river flows, and wind [3]. Solving these equations that show how water moves in an estuary is called hydrodynamic modeling.
One example of a law of physics that must be included in a computer model of any natural system is the principle of conservation of mass. In the Estuary, this principle tells us that water can move around from area to area, but it is not created or destroyed. If there is a difference between the water flow into a region and the water flow out of that region, it means that the amount of water stored in that region has changed. The same thing is true for salt moving in and out of the area.
To figure out what is happening in the Estuary, models need a lot of information about the physical forces that affect the Estuary. The forces that act on the Estuary include tides, river flows, and wind (Figure 1). These forces must be accurately measured, and those data must be entered into the model so that the model can accurately predict conditions in the Estuary. For this reason, computer modelers work with scientists, data collectors, and even other modelers to get the information models need.
Since the Estuary is so large, to create an accurate computer model of the water flow, the area of the Estuary (Figure 2A) must be divided up into individual small areas called cells (Figure 2B). The computer repeatedly calculates movement of water between each of the cells over time. One of the hardest aspects of the calculation is that the flows into and out of all the cells must agree. This means that millions of equations must be solved together, using what mathematicians call simultaneous equations. As fast as computers are today, they still struggle with problems of this size.
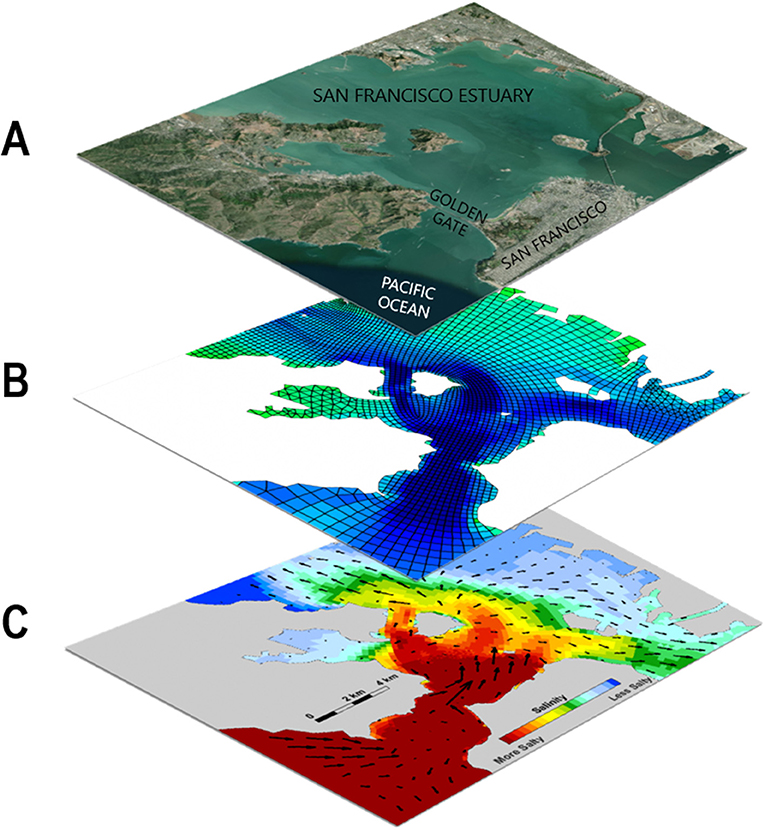
- Figure 2 - (A) Aerial view of the mouth of the San Francisco Estuary near the city of San Francisco.
- (B) To create a computer model, the area of the Estuary is divided up into many smaller grid cells. Calculations are performed simultaneously for all cells [4]. (C) Computer models can be used to predict different conditions in the Estuary. The black arrows show the predicted direction of water flow during flood tide that brings salty water (red) from the Pacific Ocean into the San Francisco Estuary through the Golden Gate where it mixes with the less salty water (blue).
Creating a model of the Estuary is a big undertaking. Once the initial work is complete, models can be used to simulate many different things, such as currents, waves, salinity, temperature, and the movement of organisms, nutrients, and sediment (Figure 2C).
Computer Models Help us Understand the Past, Present and Future of the Estuary
Computer models are powerful tools that help us to answer “what if” questions about the Estuary. We can develop computer models that include different changes to the Estuary and compare the results from these models to help understand how these changes affect the Estuary.
Computer models can be used to predict which areas of the Estuary are most likely to be flooded during storms or due to sea-level rise. We can use these results to estimate how high levees must be built to protect the homes and businesses that surround the Estuary. Many large technology companies in Silicon Valley have offices right next to the water. Computer models are being used to help us understand how high the levees must be to protect their buildings from future flooding and to restore the nearby wetlands. Recent modeling work by the United States Geological Survey was used to develop an online interactive mapping tool [5] that shows which areas are likely to be flooded because of storms and sea level rise (Figure 3A).
![Figure 3 - (A) Areas of Santa Clara County that are likely to be flooded (red outline) if sea level rises by 1.5 m [5].](https://www.frontiersin.org/files/Articles/611920/frym-10-611920-HTML-r2/image_m/figure-3.jpg)
- Figure 3 - (A) Areas of Santa Clara County that are likely to be flooded (red outline) if sea level rises by 1.5 m [5].
- (B) Predicted location of the low salinity zone in the Estuary (blue) during summer of a wet year. The low salinity zone provides important habitat for many fish [4]. (C) A computer model was used by the California Department of Water Resources to show that an emergency barrier (double black lines) could reduce the amount of salty water entering the Delta during a drought [2].
Habitats in the Estuary have changed over time because of human activities, such as draining marshes, building levees, and dredging channels. Computer models can be used to predict how habitats for fish and other organisms can be affected by these changes. One important habitat in the Estuary is called the low salinity zone (Figure 3B). The low salinity zone is an important transitional area between the salty water in the ocean and the fresh river water in the Delta. Computer models have been used to improve our understanding of how the low salinity zone is affected by the amount of freshwater that flows in from the Delta [4].
During periods of drought, reduced flow from rivers can cause an increase in salinity intrusion. If too much salty water from the ocean moves into the Delta, the water becomes too salty to use for drinking water. The California Department of Water Resources used a computer model to test whether an emergency barrier could reduce the amount of salty water entering the Delta during a drought (Figure 3C) [2]. The model showed that the barrier reduced the amount of salty water that entered the Delta.
Computer models have increased our understanding of what the Estuary was like in the past and how humans have changed it. Computer models are much faster, more versatile, and more accurate than the physical models that were used in the past. Computer modelers take real-world problems and describe them in the language of mathematics and computers. They then interpret the large amount of data produced by computer models to make the results understandable and useful. The data produced by computer models will help us understand how future changes will affect the Estuary and the communities that depend on it, so that we can protect homes and businesses as well as the health of the Estuary.
Glossary
Estuary: ↑ A partly enclosed body of water where freshwater from rivers mixes with saltwater from the ocean.
Computer Model: ↑ A program that runs on a computer to solve a set of mathematical equations.
Salinity: ↑ The amount of salt dissolved in a body of water. Salinity is measured in Practical Salinity Units (PSU), which is a measurement based on conductivity.
Gravitational Circulation: ↑ The residual flow pattern in an estuary caused by the density difference between seawater near the bed and fresher river water near the surface which results in salinity intrusion.
Salinity Intrusion: ↑ The upstream movement of saltwater beneath freshwater due to gravitational circulation.
Hydrodynamics: ↑ The study of the motion of fluids.
Conservation of Mass: ↑ The principle of conservation of mass states that in a closed system the amount of mass remains constant over time.
Low Salinity Zone: ↑ The region of the estuary where salinity is between 0.5 and 6 practical salinity units. This region provides important habitat for many fish and other animals that live in estuaries.
Conflict of Interest
MM was employed by Anchor QEA, LLC.
The remaining authors declare that the research was conducted in the absence of any commercial or financial relationships that could be construed as a potential conflict of interest.
References
[1] ↑ Brown, J., Colling, A., Park, W., Phillips, D. J., Rothery, D., and Wright, J. 1989. Waves, Tides and Shallow-Water Processes. Oxford: Pergamon Press.
[2] ↑ MacWilliams, M. L., Ateljevich, E. S., Monismith, S. G., and Enright, C. 2016. An overview of multi-dimensional models of the Sacramento–San Joaquin Delta. San Franc. Estuary Watershed Sci. 14:1–35. doi: 10.15447/sfews.2016v14iss4art2
[3] ↑ Street, R. L., Watters, G. Z., and Vennard, J. K. 1995. Elementary Fluid Mechanics, 7th Edn. Hoboken, NJ: John Wiley & Sons.
[4] ↑ MacWilliams, M. L., Bever, A. J., Gross, E. S., Ketefian, G. S., and Kimmerer, W. J. 2015. Three-Dimensional modeling of hydrodynamics and salinity in the san francisco estuary: an evaluation of model accuracy, X2, and the low–salinity zone. San Franc Estuary Watershed Sci. 13:1–37. doi: 10.15447/sfews.2015v13iss1art2
[5] ↑ Ballard, G., Barnard, P. L., Erikson, L., Fitzgibbon, M., Moody, D., Higgason, K., et al. 2016. Our Coast Our Future (OCOF). Petaluma, CA: U.S. Geological Survey CoSMoS Project. Available online at: www.ourcoastourfuture.org (accessed September 28, 2020).