Abstract
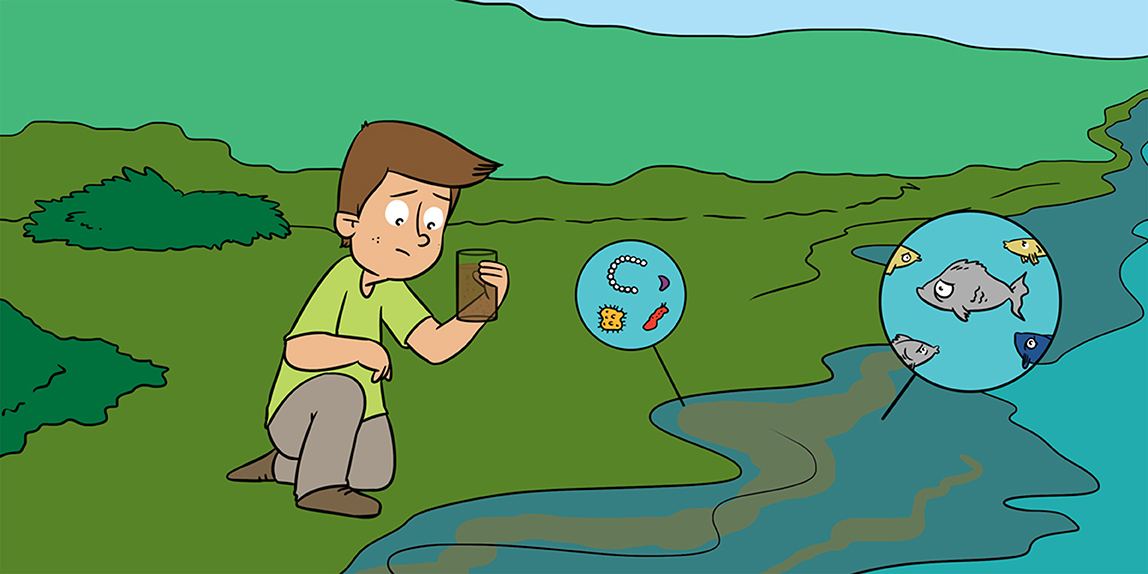
Phytoplankton are probably the most important aquatic organisms that you have NEVER seen! Phytoplankton are nearly invisible and use sunlight, carbon dioxide, and nutrients in water to produce sugars that power the estuary food web. The amount of phytoplankton growth is important because phytoplankton are the food for aquatic animals like zooplankton and fish. Scientists working in the San Francisco Estuary are concerned because phytoplankton growth is low, and some animals are starved for food. Measuring phytoplankton growth is hard because growth is low and the conditions in the water that control growth change quickly. As a result, scientists created a mathematical equation, called a model, that brings together the number of phytoplankton available to grow, the amount of sunlight, and the muddiness of the water to estimate phytoplankton growth each day. This way, scientists can determine where and when food is available to power life in the San Francisco Estuary.
Why Are Phytoplankton Important to Estuaries?
Phytoplankton (also called algae) are probably the most important aquatic organisms that you have NEVER seen! That is because most phytoplankton are so small you cannot see them with your eyes. You would need to line up between 5 and 100 phytoplankton to equal the width of a human hair! Phytoplankton are plant-like (phyto) organisms that float (plankton) in the water. They are important because they are like tiny sugar-making factories that use raw materials around them to make food for animals in the estuary. The process they use to make this food is called photosynthesis. Photosynthesis uses carbon dioxide gas and nutrients, along with sunlight, to make sugary food that powers all the animal life found in the San Francisco Estuary.
Phytoplankton have many beautiful shapes and have amazing features that help them live in an estuary. They can look like a necklace, crescent moon, or even stars. Diatoms have a hard outer “shell” made from silica, the same material as glass (Figures 1A,C,D). Their glass shells make them strong enough to withstand the action of wind and waves. Diatoms make an oil to help these heavy shells float. Because oil is lighter than water and does not mix with water, diatoms float rather than sink. Other phytoplankton called green algae are the most plant-like (Figures 1B,E,F). They are often round balls or string-like, and they are bright green due to an abundance of a pigment called chlorophyll-a that absorbs sunlight. All the plants on earth today developed from green algae. Cyanobacteria are a type of bacteria that contain a greenish-blue pigment called cyan (Figures 1G,H). Like phytoplankton, they also use photosynthesis to produce sugars for the food web. Cyanobacteria were the first organisms on Earth to use photosynthesis, more than 3 billion years ago! Dinoflagellates come in many shapes, are often yellow or reddish in color, and are sometimes encased in a plate-like armor (Figure 1I). Two whip-like tails allow dinoflagellates to swim rapidly in many directions. Although many dinoflagellates use photosynthesis to produce sugars, they can also eat other small plankton.
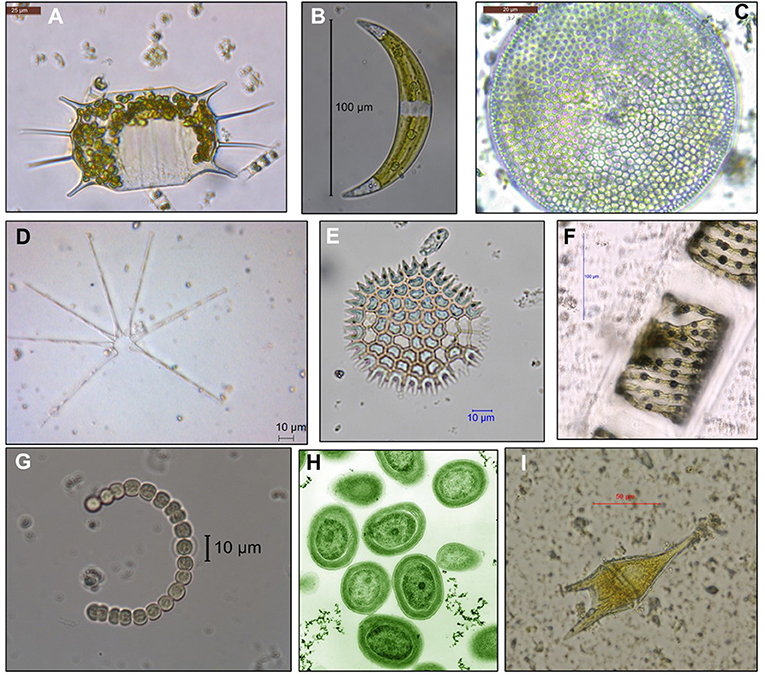
- Figure 1
- Examples of estuarine phytoplankton, including diatoms (A,C,D), green algae (B,E,F), cyanobacteria (G,H), and dinoflagellates (I): (A) Odontella sp., (B) Closterium sp., (C) Coscinodiscus sp., (D) Asterionella sp., (E) Pediastrum boryanum, (F) Spirogyra maxima, (G) Anabaena sp., (H) Prochlorococcus, (I) Ceratium furca. Scale bars are microns (μm). One micrometer equals one millionth of a meter [Image credits: All images except for (E) were provided by the California Department of Water Resources (T. Brown). Image (E) was produced by E. Barry H.F. Luke Thompson from Chisholm Lab and Nikki Watson from Whitehead, MIT, CC0 and obtained from Wikimedia Commons Rosen, Public domain, via Wikimedia Commons].
Phytoplankton grow well in estuaries where water is trapped within warm, shallow areas and sunlight, carbon dioxide, and other nutrients needed for growth are plentiful. Phytoplankton nourish many animals in the estuarine food web, including fish. In fact, estuaries are often referred to as “nurseries” for young fish because of the abundant food available for their growth. Some phytoplankton are more nutritious than others, so fishery scientists and people who fish want to understand how to grow more of the nutritious phytoplankton, so they can grow more fish.
Scientists are worried about phytoplankton in the San Francisco Estuary because, compared to many other estuaries, phytoplankton do not grow well there [1]. One major reason for low phytoplankton growth is that the Estuary has very muddy water, which blocks the sunlight needed for photosynthesis. Phytoplankton growth in the Estuary is barely fast enough to keep up with the number of phytoplankton being eaten by animals, and some animals in the estuary appear to be starved for food. This may help to explain why some Estuary fish are near extinction [2, 3].
Phytoplankton Growth Is Hard to Measure!
It is difficult to measure the growth of phytoplankton in the Estuary because they are so small. Instead, scientists estimate growth by measuring the conditions that help phytoplankton to grow. These conditions include the number of phytoplankton available to grow, the amount of sunlight in the sky, and how clear the water is. But each of these conditions changes throughout the day, the season, and the year! To solve this problem, scientists use a mathematical equation, called a model, to describe and explain what happens to phytoplankton even in changing conditions [4, 5] (Figure 2). The model predicts that there will be high phytoplankton growth on days when there are many phytoplankton around to grow, when the sun is bright, and when the water is clear and not muddy. If any of these conditions are less than ideal, phytoplankton growth will be decreased. Using the model, scientists can estimate phytoplankton growth in the estuary without ever touching the water!
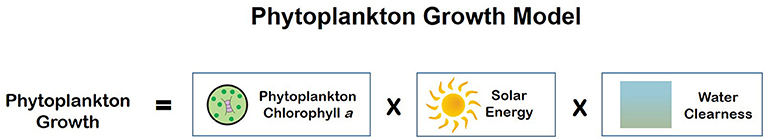
- Figure 2 - Scientists use a mathematical model to predict phytoplankton growth.
- The number of phytoplankton available to grow is estimated by the concentration of chlorophyll-a, measured a using fluorometer. Sunlight is measured using radiometer and the clearness of the water by turbidity meter. This model predicts that phytoplankton growth will be high when the number of phytoplankton available to grow is high, the amount of sunlight in the sky is high, and the clearness of the water is high.
Measuring Phytoplankton
Because phytoplankton are so tiny, it can be very difficult to count them. Instead, scientists estimate the number of phytoplankton by measuring the concentration of the green pigment, chlorophyll-a, that all phytoplankton use to absorb the sunlight needed for photosynthesis. An instrument called a fluorometer is used to continuously measure the concentration of chlorophyll-a in the waters of the San Francisco Estuary. There is more chlorophyll-a during the warm summer months when sunlight is high (Figure 3A). The amount of chlorophyll-a present each day also depends on how many phytoplankton were eaten by animals, such as zooplankton and clams during the previous day.
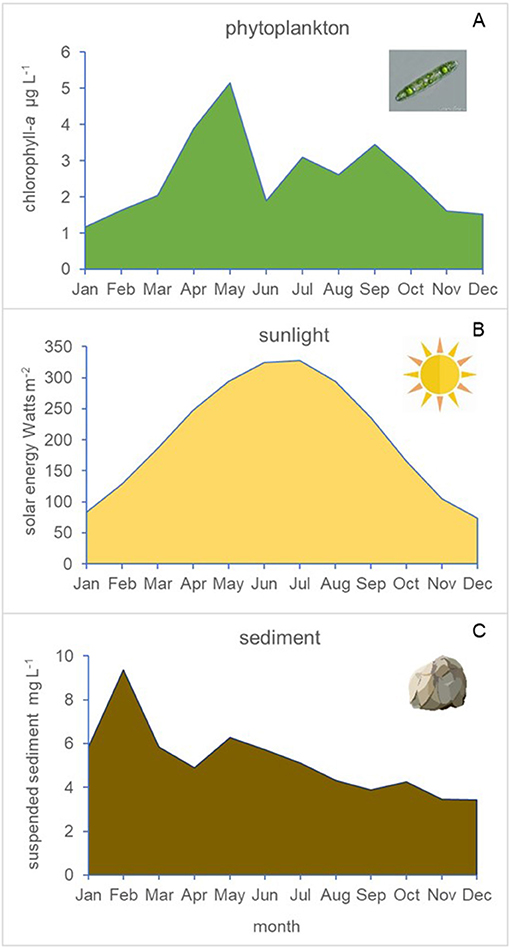
- Figure 3 - (A) Phytoplankton mostly grow in the spring and summer, so measurements of chlorophyll-a are highest then.
- However, phytoplankton are also eaten by zooplankton and clams in the summer, which decreases the amount of chlorophyll-a. (B) The amount of sunlight increases in the spring, peaks in June/July and then decreases. (C) Sediment in the water increases during the rainy season in winter and spring, as rivers carry bits of rock and sand from the mountains into the Estuary.
Measuring Sunlight
The amount of sunlight in the sky changes depending on where we are on the Earth. Near the Earth’s equator, sunlight is strong year-round. In contrast, near the Earth’s poles, the sunlight is relatively weak. Because the San Francisco Estuary is located between the equator and the North Pole, it receives an intermediate amount of sunlight that is greatest in June and July (Figure 3B). The amount of sunlight hitting the water varies each day, depending on how cloudy or clear the sky is and on the amount of fog that enters the Estuary from the nearby ocean. Instruments called radiometers are used to measure the amount of sunlight that reaches the surface of the water.
Sediment, Phytoplankton’s Sunblock
Once sunlight reaches the surface of the water, it must pass through the water to reach the phytoplankton. Here is where things become difficult for phytoplankton in the San Francisco Estuary, because the Estuary’s waters have a lot of sediment (very fine sand and mud) that makes them muddy. Muddy water blocks sunlight from entering below the surface of the water where phytoplankton can use it. The Sierra Nevada mountains, located 300 km east of San Francisco Estuary, are a major source of the sediment. Rainwater, ice, and snow break down the mountain rock, which is carried by rivers into the Estuary. Most of the rain falls between November and April, so it is not surprising that sediment is high in the water during the winter and spring (Figure 3C). Some of the sediment in the estuary today is the result of gold mining that occurred between 1848 and the mid-1850s, during the California Gold Rush!
Muddy water is also caused by sediment that sits on the bottom of the rivers and gets stirred up by winds and tides. This is particularly important for the San Francisco Estuary, which is one of the windiest estuaries in the world and has a large tide. Ocean tides move water into and out of the estuary twice each day. So, the winds and tide act like a spoon in a glass filled with water, stirring everything up and keeping the sediment in the water, where it can block the sunlight needed by phytoplankton. Muddiness from sediment in the water can be measured with a turbidity meter.
How Do Predictions of Phytoplankton Growth Help the San Francisco Estuary?
Based on the number of phytoplankton, the amount of sunlight, and the muddiness of the water—only measured in a few locations—scientists use models to estimate the growth of phytoplankton throughout the Estuary. Scientists use these estimates of phytoplankton growth to find ways to increase the amount of food for fish in the Estuary. Scientists also use estimates of phytoplankton growth to understand why fish populations change over time and how they are affected by different kinds of phytoplankton food.
Conditions in the San Francisco Estuary are changing [5]. These changes may include the growth of toxic phytoplankton, also called harmful algae [6] that are increasing with global warming and pollution. These changes may create more problems for animals that live in the estuary. Our research may help us understand how to reduce harmful phytoplankton and encourage the growth of phytoplankton that will feed estuarine animals. Whatever happens, we know that phytoplankton will continue to be among the most important aquatic organisms that you will NEVER see!
Glossary
Estuary: ↑ A place where the river meets the ocean water as it moves inland along rivers due to the tide. Tides are the daily rise and fall of ocean water due to the attraction of the moon and sun.
Photosynthesis: ↑ A process used by plants, algae, and some bacteria, which uses the Sun’s energy and carbon dioxide gas from the air to make sugars they can use for growth.
Chlorophyll-a: ↑ A green pigment in plants and phytoplankton that captures the energy of the Sun for photosynthesis.
Model: ↑ A way of using math to describe processes in nature as simply as possible.
Fluorometer: ↑ A scientific instrument used to measure the amount of light produced from a material.
Radiometer: ↑ A scientific instrument used to measure the amount of energy from the Sun.
Turbidity Meter: ↑ A scientific instrument used to measure how much light moves through water.
Conflict of Interest
The authors declare that the research was conducted in the absence of any commercial or financial relationships that could be construed as a potential conflict of interest.
Acknowledgments
PL would like to thank the California Department of Water Resources and the Interagency Ecological Program for supporting this work. Thank you to T. Brown at CA Department of Water Resources for images in Figure 2. All symbols used within the figures are courtesy of the Integration and Application Network, University of Maryland Center for Environmental Science (ian.umces.edu/symbols/).
References
[1] ↑ Boynton, W. R., Kemp, W. M., and Keefe, C. W. 1982. “A comparative analysis of nutrients and other factors influencing estuarine phytoplankton production,” in Proceedings of the Sixth Biennial International Estuarine Research Conference, ed Estuarine Comparisons (Gleneden Beach, OR: Academic Press, Inc.). p. 69–90. doi: 10.1016/b978-0-12-404070-0.50011-9
[2] ↑ Sommer, T., Armor, C., Baxter, R., Breuer, R., Brown, L., Chotkowski, M., et al. 2011. The collapse of pelagic fishes in the Upper San Francisco Estuary: El Colapso de los Peces Pelagicos en La Cabecera Del Estuario San Francisco. Fisheries 32:270–7. doi: 10.1577/1548-8446(2007)32[270:TCOPFI]2.0.CO;2
[3] ↑ Mueller-Solger, A., Jassby, A. D., and Muller-Navarra, D. C. 2002. Nutritional quality of food resources for zooplankton (Daphnia) in a tidal freshwater system (Sacramento–San Joaquin River Delta). Limnol. Oceanogr. 47:1468–76. doi: 10.4319/lo.2002.47.5.1468
[4] ↑ Cole, B. E., and Cloern, J. E. 1984. Significance of biomass and light availability to phytoplankton productivity in San Francisco Bay. Mar. Ecol. Prog. Ser. 17:15–24. doi: 10.2307/24816088
[5] ↑ Parker, A. E., Kimmerer, W. J., and Lidström, U. U. 2012. Reevaluating the generality of an empirical model for light-limited primary production in the San Francisco Estuary. Estuar. Coasts 35:930–42. doi: 10.1007/s12237-012-9507-x
[6] ↑ Lehman, P. W., Kuobe, T., Lesmeister, S., Baxa, D., Tung, A., and Teh, S. J. 2017. Impacts of the 2014 severe drought on the Microcystis bloom in San Francisco Estuary. Harmful Algae 63:94–108. doi: 10.1016/j.hal.2017.01.011