
Abstract
Sea ice forms when the surface ocean gets so cold it freezes. Sea ice is important for marine life. It can also affect how quickly the ice moving into the ocean from the continent of Antarctica melts. In this article, we describe what happens when an artist takes part in a scientific expedition to measure ocean properties beneath sea ice. The expedition required a team to live in a camp made from shipping containers on skis that are placed on the frozen ocean surface for several weeks while the team does their work. On this particular expedition, the team took an artist. After the expedition, the artist and scientists worked with school classes to build up large artworks, based on what was learned in the sea-ice camp, that help tell the story of the changing Antarctic environment in new ways.
The Ocean Beneath Ice
Antarctica is the southernmost continent on our planet. It is made up of a large ice sheet sitting on land that is completely surrounded by the Southern Ocean. The ocean around Antarctica plays an important role in keeping Antarctic covered with ice. The way the ocean circulates stops really warm water from getting far enough south to affect the Antarctic ice. But at the same time, being warmer than the ice, the ocean also helps melt the ice.
Antarctica has lots of ice, but it is not all the same. The oldest ice is found in the giant ice sheets that sit on the land. This ice is well over 1 million years old. The ice sheet is slowly moving toward the ocean. When this ice arrives at the ocean, it forms big slabs of floating ice called ice shelves. If the ice shelves melt more quickly than they do presently, the ice sheets will begin to flow into the ocean faster. This will result in increased sea-level rise [1].
In addition to the ice sheet, there is another kind of ice in Antarctica—sea ice (Figure 1). In winter, the air and oceans around Antarctica get so cold that the ocean surface freezes to form sea ice. This ice comes and goes every year with the summer-winter seasons. This cycle doubles the amount of ice-covered area every winter, before melting again in summer.
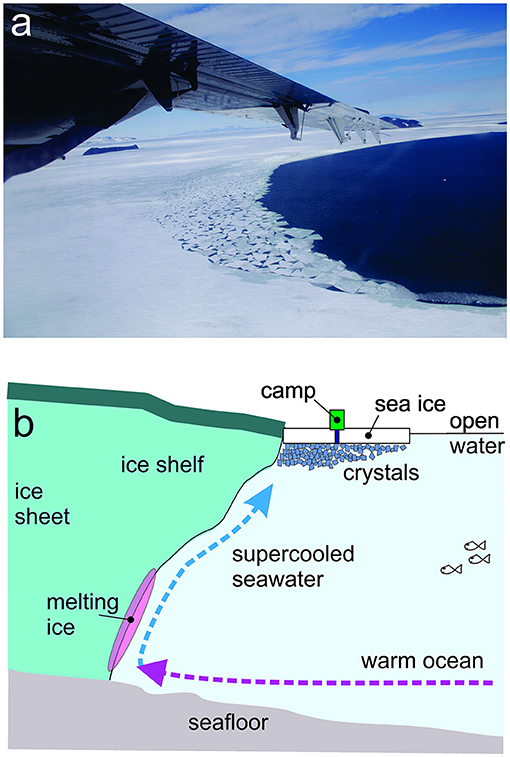
- Figure 1 - (a) Aerial view flying over the edge of sea ice, with broken up sea ice to the right and solid ice, attached to shore, on the left.
- (b) A sketch of how the ocean connects the Antarctic ice shelf to sea ice, and where crystals formed by supercooled seawater collect.
Climate research in Antarctica often involves groups of scientists setting up research camps and measuring various aspects of the environment. The scientists use the data to understand how our world works. We discovered that sometimes ice shelves help sea ice to grow. This is because, when the underside of an ice shelf melts, it creates seawater that is so cold it is actually colder than the freezing temperature of seawater. We call this supercooled seawater! This supercooled seawater turns out to be important for lots of reasons. Supercooled seawater can form crystals that float around in the ocean. The crystals look like clear, frozen, autumn leaves, ranging from the size of your fingernail up to the size of your hand. The crystals are thin—only the thickness of a few sheets of paper. These crystals float toward the ocean surface and help more sea ice to form.
To measure the properties of these ice crystals, the researchers set up a camp on sea ice in the spring, before the air temperatures warm up (Figure 2). The ice is about 2 m thick and, before camp is set up, the team and other safety experts check the conditions to make sure the ice is safe to work on. The team cuts holes in the sea ice so they can lower their instruments into the water beneath the ice. When ice crystals float up into the hole, the scientists know they have found supercooled seawater [2].
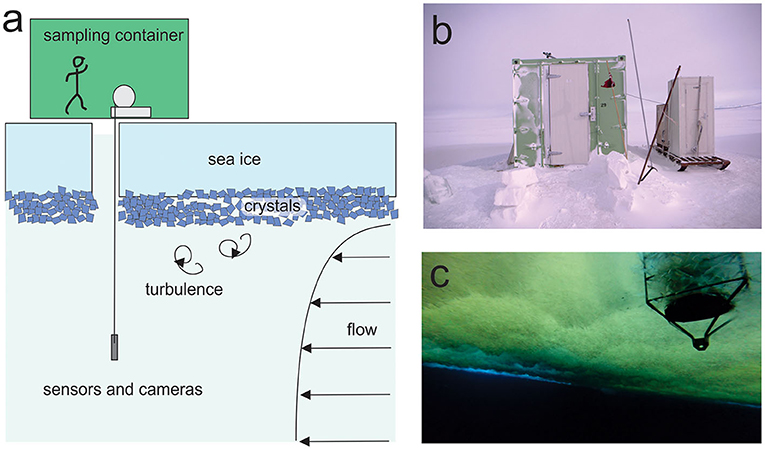
- Figure 2 - (a) Scientists “camping” on the sea ice drill a hole through the ice through which they can take measurements of the water beneath.
- When the ocean currents hit the uneven surface of the sea ice where crystals have built up, turbulence results. (b) An above-ice sampling container, which is where the scientists mainly work and live. (c) The coating of ice crystals, seen from below the sea ice.
When the crystals attach to the underside of sea ice, they make the underside rough. This is quite different to what we have found in the Arctic, where there are no ice shelves. This roughness changes the seawater flow just beneath the ice (Figure 2). Also, the ice made from crystals has lots of gaps that are great for tiny organisms to live in. This supports a very productive ecosystem and provides homes for various types of marine life.
Art and Science On The Ice
In past expeditions, the scientists tried to find ways of recording information about the ice crystals. They decided that an artist would be useful to help them describe these complex objects. It is not new to have artists work in Antarctica, as even the earliest expeditions had artists as team members. The artists would produce sketches, photographs, and paintings that are still being used today to help understand the changing Antarctic environment [3].
For our expeditions the artist [4] prepared in the same way the scientists. She did some reading to see what the environment would be like. She also developed some techniques to help prepare her equipment and materials. On the ice, she set about capturing data about the crystals as well as producing art works based on what she was observing (Figure 3).
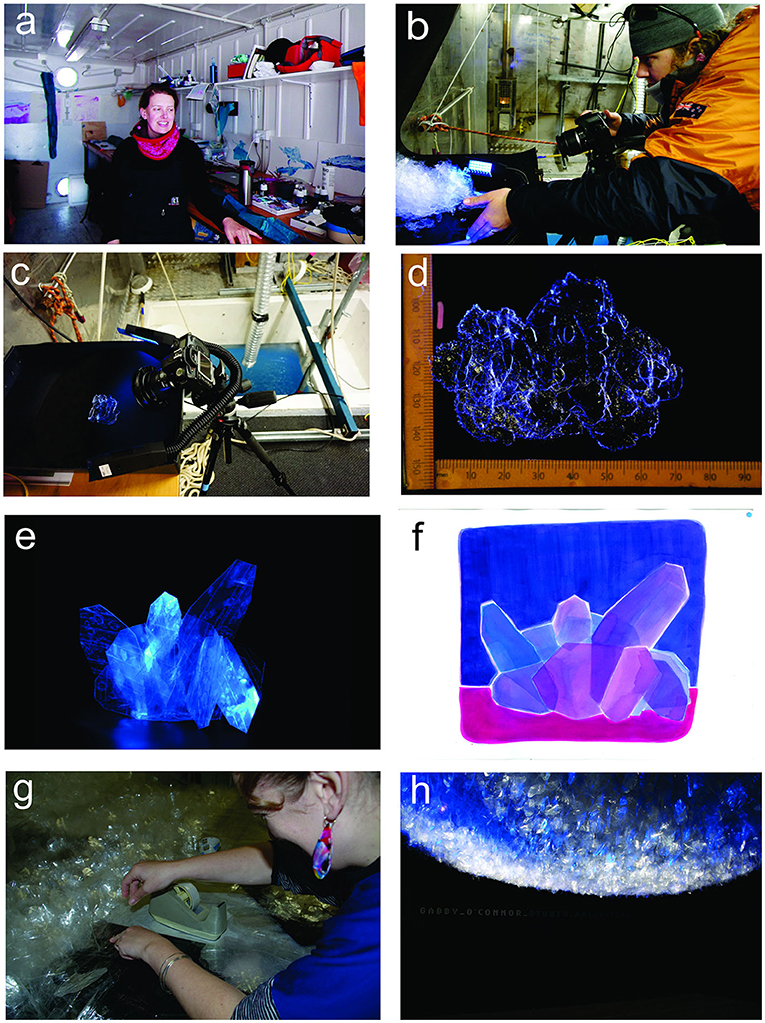
- Figure 3 - Art can help scientists and the public to understand sea ice crystals.
- (a) The artist in their container-studio on the sea ice. (b) Taking photographs in the on-ice laboratory. (c) The “stage” on which photos of sea ice are taken (Photo credit: B. Grant). (d) A photo of sea ice. (e) Image of test crystals made using packaging tape. (f) A watercolor of an ice crystal. (g) Back in Aotearoa, New Zealand, making model crystals for an exhibition. (h) A final large sea-ice artwork (~3 m across), suspended from the roof of a gallery.
The artist also had science tasks to perform. For example, she had to measure the dimensions of as many individual crystals as possible [4]. She modified methods she had developed for previous artworks to help with this new problem, and she produced pictures and measurements of many hundreds of individual crystals [3].
Back at Home Base
When the team returned from Antarctica, they had lots of data of varying types. Some of it was instrument measurements, like how cold the seawater was and how fast it was flowing. Other data were in the form of photographs and artworks, which are just as important as the measurements because they help scientists reconstruct the whole environment.
The scientists used the data, including the data collected by the artist, to work out how rough the underside of the sea ice is. Scientists do this with the help of computer models, which are tools that help with the complex mathematical calculations required to simulate how the ice changes. Computer models can be used to predict what the sea ice might do as the oceans continue to get warmer. The roughness tends to make the ocean flowing beneath the sea ice more turbulent. Turbulence is when a liquid flow is irregular and full of swirls. The turbulence of the water affects how computer models reproduce ice melting. Getting melting right is very important for providing the best predictions of how much sea ice will melt in the next 100 years.
Because the expedition generated so much interest, there was a call for a public exhibition of the artist’s work soon after the trip. This meant that the artist had to use her raw materials, which included photographs of ice crystals that looked like family portraits. There were also water color paintings of crystals (Figure 3f) as well as paintings of the places that the artist worked in. The big feature was a reproduction of the underside of the ice crystal-coated sea ice, made from packaging tape (Figure 3g), which audiences were invited to lie beneath and look up at (Figure 3h). This gave the audience the same view as the warming ocean, or that of a seal swimming around, looking for food and a hole to breathe through.
Storytelling
The science produced lots of data and enabled us to write articles for other scientists to read and debate. The data also gave us material for perhaps the most important job for climate scientists, which is to explain our changing climate to lots of different people. Some of the audiences include politicians who must make decisions about how countries behave. Other audiences include school kids and their families and caregivers, who are learning about their world [5].
Explaining ocean processes and the various types of ice is often quite complicated. We have found that these topics are easier for people to understand if we use some of the art that was produced at the same time as the science. Understanding can be deepened even further through workshops in which the audience gets to make science-based art.
You can make models of sea-ice crystals with things you have at home. We made model sea-ice crystals from packaging tape and plastic folders. Model crystals can be joined together to give a sense of how the actual sea-ice crystals arrange themselves. Through modeling, you can also get an impression of how the crystals on the underside of the sea ice form a rough boundary. Finally, modeling shows how something simple and familiar, like packaging tape, can represent something important for Earth’s climate. This art invites audiences to experience science from a new point of view.
The Future of Antarctica’s Sea Ice
Computer models help show what our planet and climate will be like far into the future. However, for the predictions to be as good as possible, the computer model must be able to accurately reproduce the life cycle of sea ice. This means the computers must be able to model sea ice at the right time of year and grow the ice at a sensible rate. Computer models must also try to show the sea ice melting like it does in real life.
However, we do not need complicated computer models to tell us that, if the ocean keeps warming, there will eventually be far less sea ice around Antarctica than there has been over the last century. Changes in the amount of sea ice will have wide-reaching effects in our future world, changing everything from global sea level to the life cycle of penguins. The more we can learn about what changes are coming for Antarctica’s ice and the oceans, the better we can plan to adapt to these changes. We will also be more motivated to live our lives in ways that reduce the amount of melting that is going to happen.
Glossary
Ice Sheet: ↑ A thick layer of ice that has built up over millions of years. As this thickens is slowly flows toward the coast where it feeds the ice shelves.
Ice Shelf: ↑ A large, floating layer of ice that was originally part of the ice sheet that sits on top of Antarctica and can be over one km thick.
Sea-level Rise: ↑ The oceans are warming, and this means they are rising due to expansion and ice melting.
Supercooled Seawater: ↑ Seawater that stays in liquid form even at a temperature colder than that at which water normally freezes.
Computer Models: ↑ A set of instructions that allow a computer to generate a virtual “world,” which scientists can study and test to help understand the real world.
Turbulence: ↑ When a fluid flows in a chaotic way, forming swirls in the water instead of flowing smoothly. Turbulence can make a big difference to how ice melts.
Acknowledgments
The authors thank Brett Grant, Tim Haskell, and Pat Langhorne for their support and Susan Debad for her editing skills. We also thank Pietro Montemurro for his valuable work assisting the young reviewers of this article. This work was funded by the New Zealand Antarctic Science Platform ANTA1801. We acknowledge the useful comments from the Young Reviewers and their mentors. Written informed consent was obtained from the individual(s) for the publication of any identifiable images or data included in this article.
Conflict of Interest
The authors declare that the research was conducted in the absence of any commercial or financial relationships that could be construed as a potential conflict of interest.
References
[1] ↑ Noble, T. L., Rohling, E. J., Aitken, A. R. A., Bostock, H. C., Chase, Z., Gomez, N., Jong, L. M., et al. 2020. The sensitivity of the Antarctic ice sheet to a changing climate: past, present, and future. Rev. Geophys. 58:e2019RG000663. doi: 10.1029/2019RG000663
[2] ↑ Stevens, C., Robinson, N., O’Connor, G., and Grant, B. 2023. Ocean turbulent boundary-layer influence on ice crystal behaviour beneath fast ice in an antarctic ice shelf water plume: the “Dirty Ice”. Front. Mar. Sci. 10:290. doi: 10.3389/fmars.2023.1103740
[3] ↑ Stevens, C., O’Connor, G., and Robinson, N. 2019. The connections between art and science in Antarctic: Activating ScixArt. Polar Record. 55:289–296. doi: 10.1017/S0032247419000093
[4] ↑ O’Connor, G., and Stevens, C. 2018. StudioAntarctica: Embedding art in a geophysics sea ice expedition. Leonardo 51:57–58. doi: 10.1162/LEON_a_01556
[5] ↑ O’Connor, G., and Stevens, C. 2015. Combining art and science in a primary school setting: paper and ice. J. Sci. Commun. 14:A04. doi: 10.22323/2.14040204