Abstract
Greenhouse gases (GHGs) help to maintain the Earth’s temperature by trapping heat. Without GHGs, our planet would be so cold that no life could exist. In the present era, human activities such as the burning of fossil fuels emit huge amounts of GHGs into the atmosphere each year. Consequently, the Earth’s temperature is increasing to an uncomfortably high level. To halt the rise in Earth’s temperature, we must reduce and ultimately eliminate GHG emissions. However, reducing emissions may not instantly result in lower GHG levels in the atmosphere, as the GHGs we emit now can remain in the atmosphere for decades to centuries. This article explains the rate at which two essential GHGs (carbon dioxide and methane) might accumulate in the atmosphere and how their concentrations could change in the future because of emissions reductions.
Greenhouse Gases
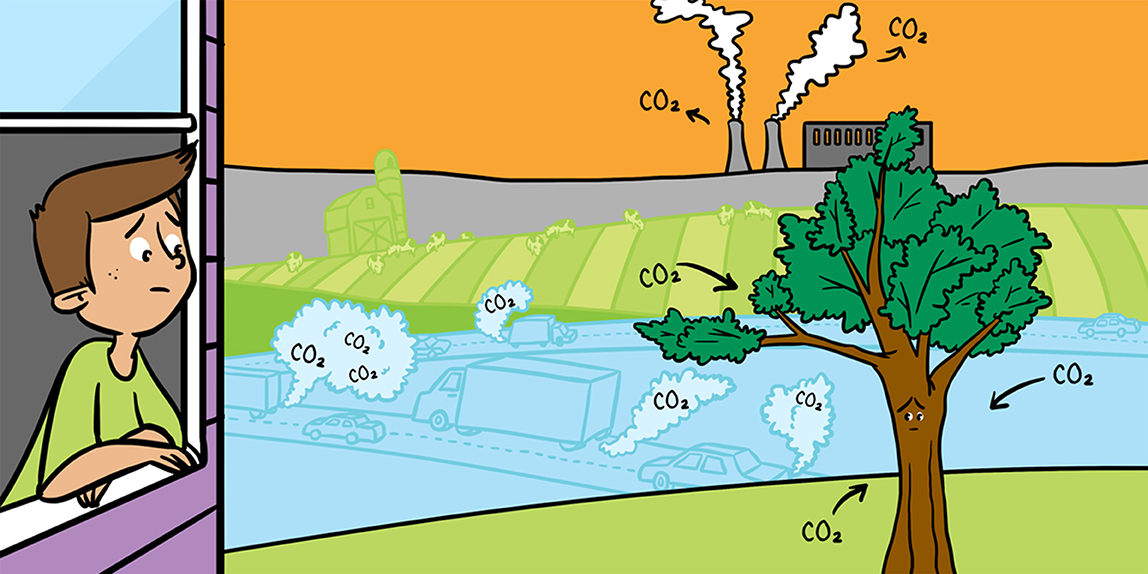
Greenhouse gases (GHGs) are a vital component of the atmosphere and they control the state of Earth’s climate. Without GHGs, Earth would be a frozen, uninhabitable world. Due to GHGs, Earth’s average surface temperature is about 15°C, but it would be −18°C without GHGs—approximately a 33°C increase above the GHG-free atmosphere. GHGs give us a livable planet. Water vapor (water in the form of gas), carbon dioxide (CO2), and methane (CH4) are the most abundant GHGs in Earth’s atmosphere. For millennia, these GHGs have been part of Earth’s atmosphere, because they are produced by natural processes. However, humans have altered the levels of GHGs in the atmosphere. We cut down trees to clear land for growing crops or to use as wood for construction. We burn wood and fossil fuels like coal, oil, and gas, and burning emits a large amount of CO2 into the atmosphere. We have increased CH4 concentrations through coal mining, by pumping gas via leaky pipes to warm our homes, by dumping our waste in open areas, and by raising large numbers of cows and sheep for milk and meat production.
How Long Do GHGs Stay in the Atmosphere?
After emission, each of the GHGs stays in the atmosphere for a different length of time. Think about it like a bathtub—the amount of water in the bathtub depends on the input from the tap and the output via the drain. A wide drain hole allows for quick removal of water from the bathtub, while water will be retained in the tub for longer if the drain hole is narrow. The same principle also explains how long GHGs stay in the atmosphere (Figure 1). The atmosphere (bathtub) fills up with billions of tons of GHG emissions from human activities and drains due to natural activities. For example, CH4 is removed from the atmosphere by natural chemical reactions with hydroxyl radicals, chlorine, and oxygen (Figure 1B). CO2 is removed from the atmosphere by photosynthesis and is absorbed by the oceans (Figure 1A). For both CO2 and CH4, the amounts produced (inflows) and removed (outflows) are out of balance; inflows outweigh outflows. Excess emissions cause GHGs to accumulate in the atmosphere. As a result, the GHGs we emit now exist in the atmosphere for a long time, ranging from a few years to centuries. The lifetime of a given GHG in the atmosphere is measured by the time that required to remove half of the released amount from the atmosphere.
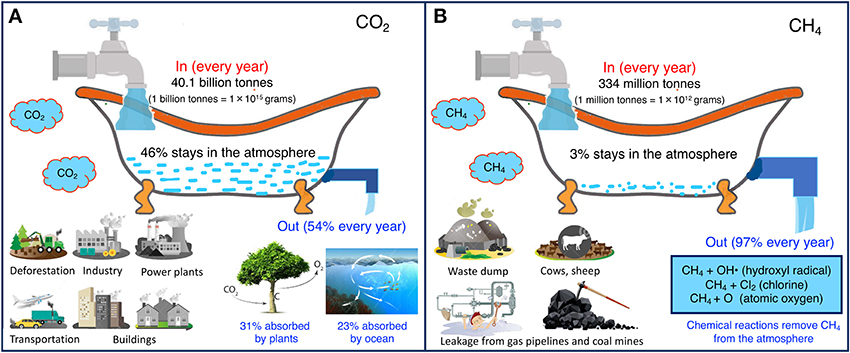
- Figure 1 - CO2 and CH4 cycles, using a bathtub analogy.
- Inflows indicate total yearly emissions from human activities. The water left in the bathtub reflects the accumulation of CO2 and CH4 in the atmosphere every year. The wider drain hole in the CH4 bathtub illustrates that CH4 is removed from the atmosphere more quickly than CO2 is removed. The latest Intergovernmental Panel on Climate Change (IPCC) report gives more details on GHG emissions and removals [1]. The idea for this figure came from https://www.climateinteractive.org/tools/climate-bathtub-simulation/. (A) CO2. (B) CH4.
CH4 is removed from the atmosphere faster than CO2 is removed, because there are no chemical reactions that remove CO2 from the atmosphere. As a result, the lifetime of CH4 (about 10 years) is shorter than that of CO2 [2]. Unlike CH4, CO2 is not destroyed—it just moves from the atmosphere into storage locations on land and in the ocean, through processes including photosynthesis. CO2 is stored in ecosystems in the form of carbon, which is eventually emitted back to the atmosphere [1]. For example, when a plant dies, the carbon stored in the plant is released back to the atmosphere. The flows of carbon throughout the atmosphere, plants, and the ocean are complex and challenging to understand. Calculating the exact lifetime of CO2 in the atmosphere is difficult because of all these complex processes. Rather than a single value, scientists provide a range: for every kilogram of CO2 emitted, 40% remains in the atmosphere after 100 years, 20% after 1,000 years, and 10% after 10,000 years [3, 4].
How Will GHG Concentrations Change in the Future?
The natural removal of CO2 and CH4 from the atmosphere is not enough to cancel out man-made emissions, so their concentrations are quickly increasing [1]. Every ton of CO2 and CH4 remaining in the atmosphere causes heating, so Earth’s temperature is rising to an uncomfortably high level. To stop or limit future global temperature increases, we must stop adding CO2 to the atmosphere.
Since it is impossible to predict how emissions will change in the future, experts look at a range of different outcomes, called scenarios, in which they account for population growth and economic growth. We will look at three different emission scenarios, called SSP1, SSP2, and SSP3; SSP stands for “shared socio-economic pathways” (Figure 2). SSP1 is an ideal scenario, in which there is a rapid decrease in GHG emissions, while SSP3 is an extreme scenario, in which emissions continue to rise. SSP2 is an intermediate scenario, in which emissions gradually decrease until the end of the century. How will GHG concentrations change under the three scenarios? Scientist use computer models of the climate system, called climate models to predict future GHG concentrations. In these models, various processes occurring in the atmosphere, on land, and in the ocean interact with each other.
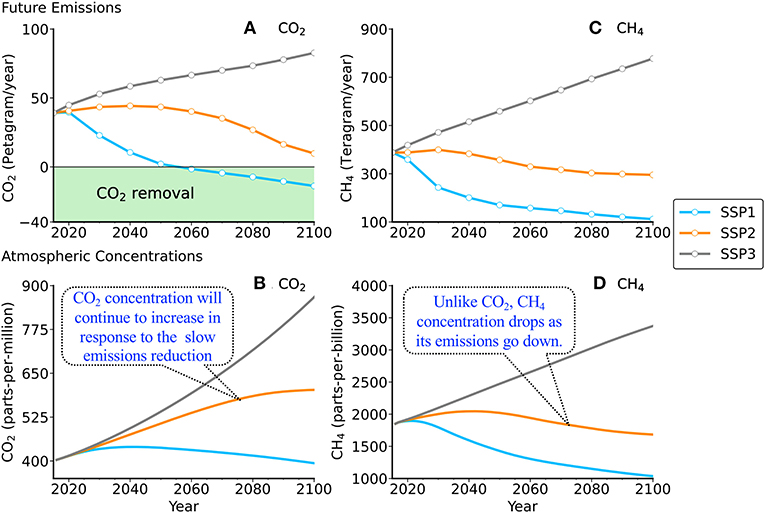
- Figure 2 - Three scenarios for GHG emissions (A,B) and their effects on atmospheric concentrations (C,D).
- SSP1 is an ideal scenario, with a rapid decrease in GHG emissions. SSP2 is an intermediate scenario. SSP3 is an extreme scenario in which emissions continue to rise.1 A petagram (1 billion tons or 1 × 10¹⁵ grams) is equivalent to the weight of 100,000,000 elephants or the water in 400,000 Olympic pools. One teragram is equivalent to 0.001 petagram. The concentrations are in parts-per-million (ppm) or parts-per-billion (ppb). One ppm is equivalent to 1 L of water in a swimming pool; 1 ppb as 1 ml of water.
Future concentrations of CO2 and CH4 in the air largely depend on decisions we make now (Figure 2). Without global action to rein in GHG emissions (SSP3), CO2 and CH4 concentrations will continue to increase through the twenty-first century and beyond. This would result in huge environmental effects. On the other hand, if countries gradually reduce their GHG emissions as in SSP2, although CH4 concentrations would peak and decline, the CO2 concentration would not. This is because CH4 has a short half-life in the atmosphere, so levels will drop within about 10 years after emissions decrease, while CO2 has a long half-life and responds more slowly. As long as we keep emitting CO2, its concentration will continue to rise. The atmospheric CO2 concentration can only stabilize and drop after CO2 emissions are reduced to zero and we take steps to actively remove it from the atmosphere, as in SSP1. This would be very challenging to do.
We Must Act Now!
In summary, the different atmospheric lifetime of each GHG dictate how quickly they are removed from the atmosphere. CO2 concentration stabilizes or decreases only after a few decades of reducing CO2 emissions because it has a very long half-life in the atmosphere. Any short-term reductions in CO2 emissions, like those we have seen during the COVID-19 pandemic, do not have a detectable effect on atmospheric CO2 concentration or global temperature. Recent studies show that global temperature will take a long time to fall after CO2 emissions reach zero. In fact, the CO2 response time is so long that we may not notice the effect while we are still alive. On the other hand, atmospheric CH4 levels respond swiftly to reductions in emissions, so reducing CH4 emissions is important for stopping global warming in the short term.
Eventually, the awareness about the impact of our habits on climate can help to control/reduce climate change. The more we learn about the GHGs emission sources and their sustaining footprints in our atmosphere and climate, the better we can plan to avoid them. This basic information can help to imagine how our present activities and decision will decide future GHGs levels in the atmosphere. Nevertheless, there is hope to defeat the climate change monster, but we all have to behave responsibly and start reducing GHG emissions from our daily activities.
Glossary
Concentration: ↑ The amount of a particular gas in the atmosphere. CO2 concentrations are measured in parts-per-million (ppm) and CH4 in parts-per-billion (ppb). One ppm is equivalent to one drop of water diluted into roughly 13 gallons of liquid.
Inflow: ↑ The process/measure of incoming mass. The emissions entering into the atmosphere from different sources at surface can be consider as inflow here.
Outflow: ↑ The process/measure of outgoing mass. The emissions removed from atmosphere by different natural processes can be consider as outflow here.
Climate Models: ↑ A set of computers programs, like a laboratory in a computer, that helps scientists understand how various factors influence Earth’s climate.
Conflict of Interest
The authors declare that the research was conducted in the absence of any commercial or financial relationships that could be construed as a potential conflict of interest.
Acknowledgments
This study was supported by NIES’s Climate Change and Air Quality Research Program. NC would also like to acknowledge the funding from Arctic Challenge for Sustainability phase II (ArCS-II; JPMXD1420318865) Projects of the Ministry of Education, Culture, Sports, Science, and Technology (MEXT). We thank the young reviewer for their time and valuable suggestions for this article. We sincerely thank Dr. Prabir Patra, JAMSTEC, for the various discussions and the help from Himani Negi, Shraddha, and Ikshu is greatly appreciated for their suggestions in the initial draft stage.
Footnote
1. ↑Emissions scenarios are based on population and economic growth in the future. See: https://tntcat.iiasa.ac.at/SspDb and [5].
References
[1] ↑ Canadell, J. G., Monteiro, P. M. S., Costa, M. H., Cotrim da Cunha, L., Cox, P. M., Eliseev, A. V., et al. 2021. “Global carbon and other biogeochemical cycles and feedbacks,” in Climate Change 2021: The Physical Science Basis. Contribution of Working Group I to the Sixth Assessment Report of the Intergovernmental Panel on Climate Change, eds V. Masson-Delmotte, P. Zhai, A. Pirani, S. L. Connors, C. Péan, S. Berger, et al. (Cambridge; New York, NY: Cambridge University Press), 673–816. doi: 10.1017/9781009157896.007
[2] ↑ Patra, P. K., Houweling, S., Krol, M., Bousquet, P., Belikov, D., Bergmann, D., et al. 2011. TransCom model simulations of CH4 and related species: linking transport, surface flux and chemical loss with CH4 variability in the troposphere and lower stratosphere. Atmos. Chem. Phys. 11:12813–37. doi: 10.5194/acp-11-12813-2011
[3] ↑ Archer, D., Eby, M., Brovkin, V., Ridgwell, A., Cao, L., Mikolajewicz, U., et al. 2009. Atmospheric lifetime of fossil fuel carbon dioxide. Ann. Rev. Earth Planet. Sci. 37:117–34. doi: 10.1146/annurev.earth.031208.100206
[4] ↑ Inman, M. 2008. Carbon is forever. Nat. Clim. Change 1:156–8. doi: 10.1038/climate.2008.122
[5] ↑ Meinshausen, M., Nicholls, Z. R. J., Lewis, J., Gidden, M. J., Vogel, E., Freund, M., et al. 2020. The shared socio-economic pathway (SSP) greenhouse gas concentrations and their extensions to 2500. Geosci. Model Dev. 13:3571–605. doi: 10.5194/gmd-13-3571-2020