Abstract
The San Fransisco Estuary is an important nursery for young fish. Scientists use special nets and techniques to identify and count small fish in the estuary. Knowing how many and where the young fish are helps managers avoid harm to fish populations. Water flowing in rivers naturally flows out to sea, but in the San Francisco Estuary, some of that water is stored in reservoirs or pumped to other parts of California, which can have a negative impact on fish populations. These and other challenges to fish have resulted in severe declines in numerous species. In this article we will describe how we monitor young fish population trends. We also describe how the sampling method changes depending on the habitat and time of year sampling occurs. Finally, we explain how the information is used by scientists, managers, and the public within the San Francisco Estuary, California, USA.
Why do We Monitor Young Fish?
Young, small fish are not very good swimmers. Fish start out as eggs that hatch into what are called larvae. The larvae are very small and skinny, a few millimeters long in most cases, like the width of a pencil eraser. They are difficult to see! Larvae do not look like adults; they tend to be see-through and lack fins and muscles. During the larval stage, fish drift in the currents. As fish grow larger, they develop muscles and fins that improve their ability to swim. Many also develop air bladders (Figure 1). An air bladder is an organ that fills with air to keep the fish at the right water depth, so that they do not completely sink or float. Eventually, larvae become juveniles, which look like adults but still have growing to do before they can produce eggs. Juvenile fish can ride water currents to areas with beneficial temperatures and food. Many eat small crustaceans called zooplankton; when abundant can help the fish grow fast. While riding water currents works well in an estuary where natually flowing rivers and the tidal ocean mix, it can be problematic in modified systems like the San Francisco Estuary (SFE), where humans have changed the amount and direction of water flow, and fish and their food can end up in places they do not belong [1].
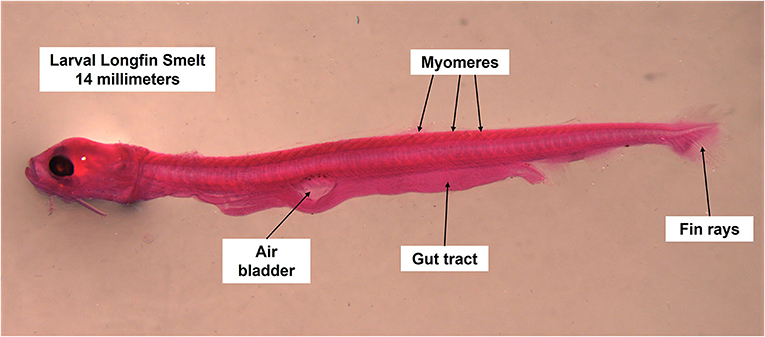
- Figure 1 - A larval longfin smelt that is 14 mm long.
- The key parts used in identification of the species are shown. This fish has been preserved in a preservative solution and dyed pink.
The SFE is at the heart of the California water system. This system manages water for both fish and humans. Governments have modified natural waterways to move freshwater to where it is needed. These modifications include dams and reservoirs on rivers to control flows, and export facilities that pump water into canals and pipes. The SFE has many water export facilities, including hundreds of small water pumps for agricultural use, medium water pumps for city drinking water or businesses, and two very large pumps in the south Delta that provide agriculture and drinking water to half the state of California! The amount of water pumped out of the south Delta is so great that the water flow in the rivers can be reversed tens of kilometers away. Fish within the influence of the pumps can easily become captured (known as entrainment), by the export facilities. This is especially true of very small fish and larvae that drift with flows and currents.
To prevent loss of fish by entrainment, scientists and resource managers are interested in knowing where young fish are, to keep them away from the pumping facilities. We are also interested in knowing how many total fish there are, so that we can track their population trends every year, to know how much of the population is at risk of entrainment. This is especially important for fish populations that have declined and now are on state and federal endangered species lists1. These native fish require special protections to prevent additional harm to their populations. Sadly, the SFE has many such species, including Delta smelt, longfin smelt, Chinook salmon, steelhead trout, and green sturgeon.
Sampling in a consistent way over time is called monitoring. Monitoring has shown that native fish populations have declined in the SFE. There are many factors that contribute to declining fish populations in addition to water exports and flow changes. These include loss of habitat, predation, competition with introduced species, climate change, and food limitation. Therefore, to understand what we can do for the fish populations, we have to monitor more than just fish abundance. Scientists measure conditions that the fish experience, such as water quality (temperature, salinity, water clarity), hydrodynamics (how fast the water moves and in what direction), climate (wind speed, air temperature), contaminants (pollution), and the food web. Measuring food availability is especially challenging, as it means capturing other very small plants and animals. Scientists look at all these measures, along with the numbers and types of fish that they catch, to understand what influences the increase or decrease of fish populations each year.
How do We Monitor Young Fish?
The SFE is a very dynamic system, and the native species are highly adapted to the natural changes. There are over 120 species of fish in the San Francisco Estuary! Since the SFE connects rivers to the ocean, not all fish are present in the SFE all the time. In many cases, the SFE is a migration pathway. This means that fish travel through the SFE on their way upriver or out to sea, but they do not hang around for long periods of their lives. Even species that do spend their whole lives in the SFE, like Delta smelt [2], still have seasonal spawning movements. In the spring, during spawning, they are distributed farther upstream, which puts them at higher risk of entrainment. Similarly, species of various sizes are in the SFE at various times. For example, a young Chinook salmon on its way to the ocean is much larger than a young longfin smelt, even when they are both in the same place at the same time. Because the sizes of fish and the seasons they are present in the SFE vary among species, we use various types of nets to capture a wide variety of species. It is important to pick the right tool for the job!
One common way of catching small fish is by towing a net through the water (Figure 2). Fishing nets come in various shapes and sizes. The net mouth opening can be large for juvenile fish (15 m2) or small for larval fish (0.4 m2). The net mesh openings retain fish of a certain shape and size. For example, nets with very small holes in the mesh (1.6 mm) capture small, larval fish, whereas nets with larger holes (12.7 mm) capture larger, juvenile fish. Catching small fish can be challenging, because small mesh openings will let less water through, thus slowing the net in the water. When the net is moving slowly, large fish might be able to swim out of the net! Net efficiency means matching the size of the net mesh to the size range of the fish we want to catch. When the net is hauled out of the water, all the fish are concentrated at the end of the net, called the cod-end. The cod-end can be made of soft mesh or a hard box or bottle (Figure 2).
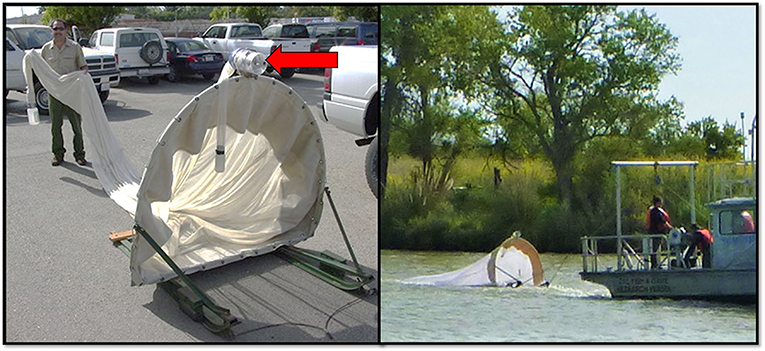
- Figure 2 - A net used to capture larval and juvenile fish in the SFE, called a 20-mm net.
- It has a rigid mouth frame (mouth area 1.5 m2), is 5.5 m long, and has mesh holes that are 1.6 mm. A zooplankton net is mounted on top (red arrow), so that fish food can be captured at the same time. Both the fish and zooplankton nets have plastic cod-end jars to concentrate the contents. Contents are poured into sample containers with preservative solution, and returned to the laboratory for processing.
Larger fish can be identified and measured on the boat and released alive, whereas smaller fish are kept in sample jars. Small fish and zooplankton are fragile and must be fixed and preserved using a solution that prevents them from decaying or falling apart when we handle them. Fish samples are taken to the laboratory to be measured and identified under a microscope [3]. Identification of small fish from around 5–50 mm fork length (approximately the width of a pencil eraser to the width of two quarters side-by-side) can take 8–20× magnification. Tweezers are used to count the muscles (myomeres), fin rays, or length of gut tracts, and to help us see other unique features that allow us to identify the species (Figure 1). Sometimes, small fish are even dyed pink to make them easier to see.
How is the Data Used?
In the SFE, the species of greatest concern for managers, particularly those on endangered species lists, are mostly pelagic, meaning they live in open-water habitats. Data from towed nets includes the amount of water sampled. Scientists relate the amount (volume) of water sampled with the fish catch in each tow, then they combine catch data from all the tows in an area (bay or river). These data can then be scaled up to represent the total amount of water in an area, which allows us to estimate the abundance of fish. By looking at specific sampling locations, we can determine how much of the fish population is in “safe” areas where they can grow and survive, and how much is in areas near pumping facilities that could cause population loss.
Keeping fish populations safe requires both short-term and long-term management. Short-term management involves reviewing conditions and monitoring data each week, to make recommendations to modify water flows or change the amount of of water that is exported. Once we get a picture of where the fish are and how many are present, we can adjust water flows so that they are the most beneficial for fish (Figure 3). Long-term management requires the continuous collection of monitoring data and frequent special studies. Many experts are needed to analyze the data and to answer questions about how the water system is functioning and how each species is affected by changing conditions.
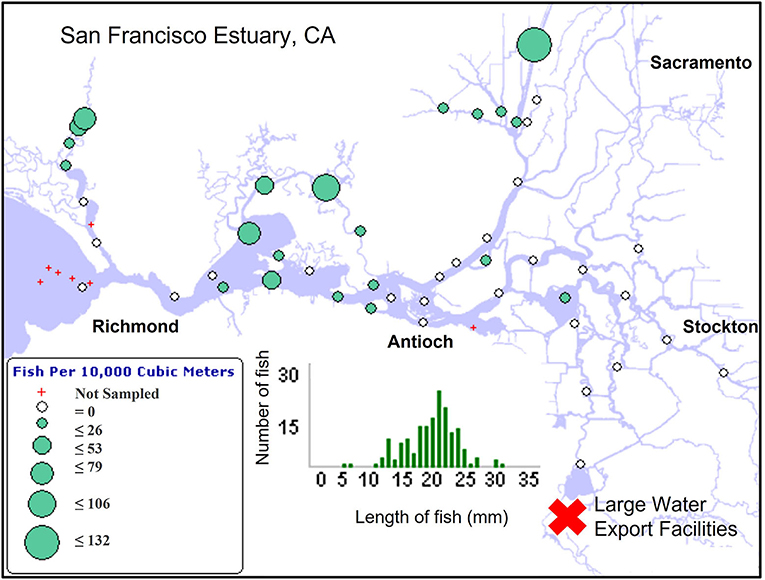
- Figure 3 - An example of data showing Delta smelt distribution and relative abundance in the SFE, from a survey done with a 20-mm net.
- Green circles show where fish were captured and the number of fish per volume of water. Larger circles mean more fish were captured. The center graph shows the number fish of each length that were captured. Approximate city locations and locations of large water export facilities (red X) are also shown.
Monitoring to Advance Fish Conservation
The SFE is a complex and busy place! Humans have significantly altered this system to provide water for multiple uses, including drinking water and agriculture. These changes have altered the habitats of the plants and animals that live in the SFE, causing several fish species to become endangered. Monitoring fish populations is extremely important to help with the recovery of endangered fish species. Monitoring allows the comparison of current and past conditions, so that water resources can be managed in a way that best meets the needs of fish and the habitats they rely upon. With proper management, the SFE can be a safe and healthy place for fish to live, while still serving as an important water supply for all of California.
Glossary
Larvae: ↑ Immature or young fish that look different from the adult form of the same species. One fish is called a larva. Larvae refers to more than one immature fish.
Zooplankton: ↑ Microscopic animals that float, drift, or weakly swim with water currents.
Entrainment: ↑ The transport of fish with the flow of water, out of their natural habitat into unnatural or harmful environments, resulting in loss to the population.
Net Efficiency: ↑ A trawl net’s ability to catch fish of a specific size and shape.
Cod-end: ↑ The narrow end of a fish catching trawl net that collects and concentrates the fish. This portion of the net is usually opened to remove the fish.
Fork Length: ↑ The measure of a fish from the tip of the head to the fork in the tail.
Myomere: ↑ Muscles in fish that form a V (or sometimes W) shape and are easy to see on larval fish. Myomere counts are often used to identify a larval fish. See Figure 1.
Pelagic: ↑ Open-water, not near the shore or bottom.
Conflict of Interest
The authors declare that the research was conducted in the absence of any commercial or financial relationships that could be construed as a potential conflict of interest.
Acknowledgments
This work was produced under the auspices of the Interagency Ecological Program. Funding was provided by reimbursable contracts with the California Department of Water Resources (R1730002) and the U.S. Bureau of Reclamation (R21AC10417).
Footnote
1. ↑https://wildlife.ca.gov/conservation/cesa
References
[1] ↑ Rubissow-Okamoto, A., and Wong, K. 2011. Natural History of San Francisco Bay. California Natural History Guides. Los Angeles, CA: University of California Press.
[2] ↑ Moyle, P. B., Brown, L. R., Durand, J. R., and Hobbs, J. A. 2016. Delta smelt: life history and decline of a once-abundant species in the san francisco estuary. San Franc. Estuary Watershed Sci. 14:6. doi: 10.15447/sfews.2016v14iss2art6
[3] ↑ Zale, A. V., Parrish, D. L., and Sutton, T. M., editors. 2013. Fisheries Techniques, 3rd Edn. Bethesda, MD: American Fisheries Society.