ملخص
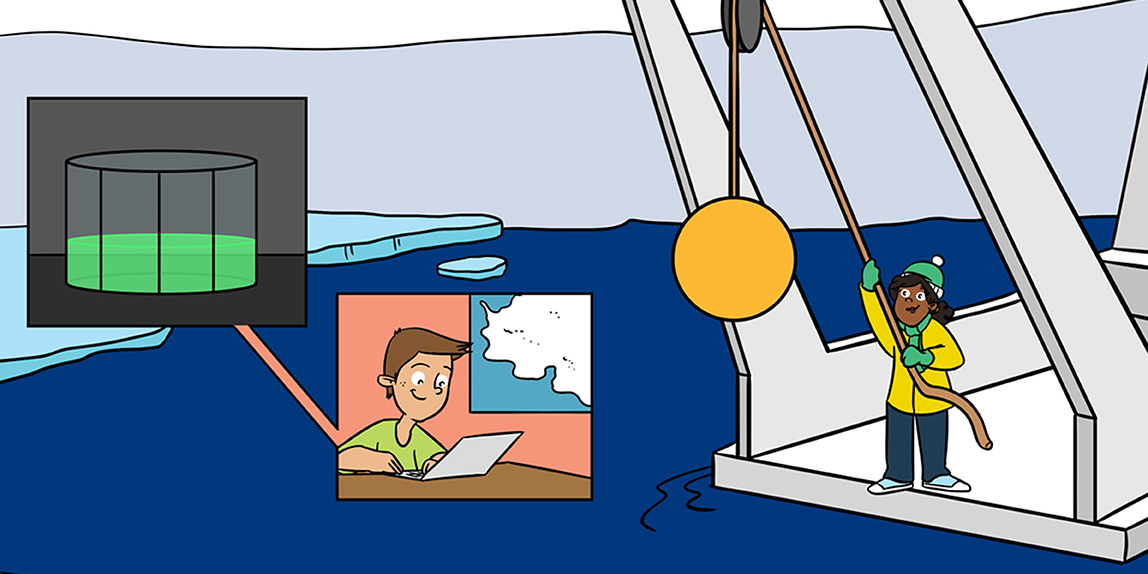
ذهبنا إلى القارة القطبية الجنوبية (أنتاركتيكا) على متن سفينة أبحاث لتثبيت أجهزة قياس وتركناها في المياه لتدوين القياسات لمدة عامين. وأثناء استخراج الأدوات، ذهبنا إلى منشأة بحثية بها حمام سباحة مليء بمياه تدور في دوامة لمدة شهرين. لقد فعلنا كل ذلك لنفهم ما إذا كانت التيارات الدافئة تعمل على إذابة الجليد في القارة القطبية الجنوبية [1]. إذن، ماذا كان الجواب؟ دعنا نبدأ حديثنا من نقطة البداية...
قارسة البرودة وبعيدة للغاية: القارة المتجمدة وأهميتها
تُعد أنتاركتيكا - وهي كتلة اليابسة الضخمة في القطب الجنوبي - القارة الوحيدة التي لا يسكنها إنسان بصورة دائمة (الأشكال رقم 1A-D)، حيث تتميز بجوها قارس البرودة؛ حيث يبلغ متوسط درجة الحرارة −10 درجة مئوية (14 درجة فهرنهايت) بالقرب من الساحل و −60 درجة مئوية (−76 درجة فهرنهايت) في المناطق الداخلية من القارة. وتُغطى أنتاركتيكا بالكامل بطبقة من الثلج والجليد تقريبًا، حيث يصل سمك هذا الغطاء الجليدي إلى 5 كيلومترات (3 أميال) ويزداد سمكًا مع تساقط الثلوج عليه. تُعرف أجزاء الغطاء الجليدي التي تطفو فوق سطح المحيط، ولكنها لا تزال متصلة بالغطاء الجليدي باسم الجروف الجليدية. وقد تمتد لعدة كيلومترات بعيدًا عن الأرض. حيث تنكسر الجبال الجليدية الضخمة وتترك جدارًا من الجليد يصل ارتفاعه إلى 250-500 متر (820-1640 قدمًا) أسفل المحيط.
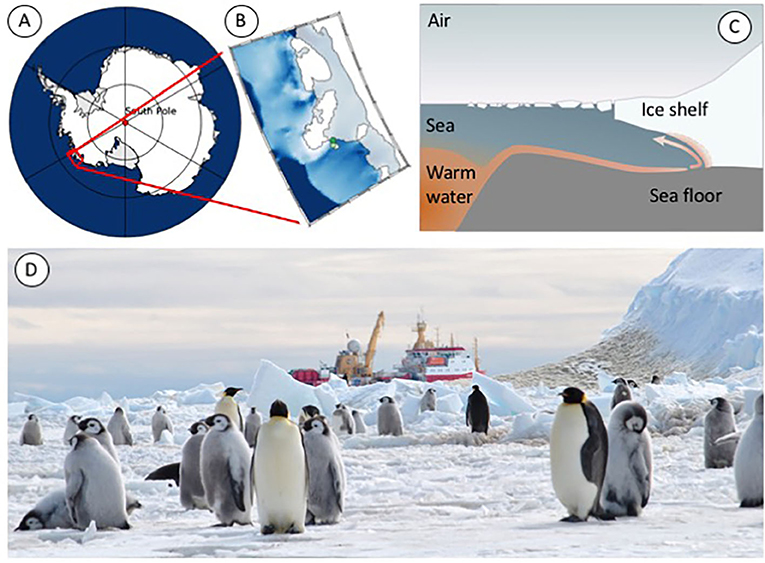
- شكل 1 - (A) خريطة أنتاركتيكا والمنطقة التي نعنيها بشكل خاص (الصندوق الأحمر).
- (B) تشير النقاط الخضراء إلى مواقع مراسينا. (C) هذا ما سيبدو عليه الجرف الجليدي عند انكساره نصفين والنظر إليه من الجانب. سيقع جزء منه على الأرض وفي قاع البحر، حيث يتدفق صوب المحيط المفتوح، ويقل سمكه تدريجيًا بسبب الذوبان. وتنفصل أجزاء من الجرف الجليدي وتطفو بعيدًا. ويتدفق تيار من المياه الدافئة نسبيًا باتجاه الجرف الجليدي في قاع البحر. (D) سفينة الأبحاث RV Shackleton في إحدى رحلاتها إلى أنتاركتيكا، راسية بالقرب من الجرف الجليدي.
ومن الأهمية بمكان التمييز بين الجروف الجليدية والجبال الجليدية والجليد البحري؛ على الرغم من أنها تطفو جميعًا على المحيط [2]، حيث يتشكل الجليد البحري حين تتجمد المياه في المحيط، على غرار الجليد الذي يتشكل على البحيرات. وحين يذوب الجليد البحري لا يضيف المزيد من المياه إلى المحيط، لذا لا يتغير منسوب البحار. على خلاف الجليد الذي ينشأ على اليابسة، حيث يتسبب في ارتفاع مستوى سطح البحر حين يذوب. وتتكون الأنهار الجليدية في أنتاركتيكا في بادئ الأمر في صورة غطاء جليدي يستقر على الأرض ولكن تطفو أجزائها البعيدة عن الشاطئ على المحيط. وتُعتبر هذه الأجزاء بمثابة مصد يحافظ على ما تبقى من الجليد على الأرض. وإذا ذاب الجليد العائم، فسوف ينزلق المزيد من الجليد من اليابسة إلى المحيط ويسبب ارتفاع مستوى سطح البحر.
من المتوقع، في أسوأ الحالات تقديرًا، ارتفاع مستوى سطح البحر بمقدار 5 سم/سنة (2 بوصة/ سنة). هذا يحدث بسرعة حقًا! فتخيل أن هناك بقعة بالقرب من المحيط بإمكانها بالكاد أن تبلل أصابع قدمك فقط الآن، ثم بعد أربعين عامًا من الآن، سيتخطى مستوى المياه بها رأسك! فمن الأهمية بمكان التنبؤ بمدى سرعة ارتفاع مستوى سطح البحر حتى نتمكن من الاستعداد لذلك جيدًا. لذا، نحن في حاجة إلى معرفة مقدار ذوبان الجليد فعليًا وما سبب هذا الذوبان.
المحيط يُذيب جليد أنتاركتيكا
كان الجليد يذوب بشكل أسرع على مدى العقود الماضية بسبب تغير المناخ وارتفاع درجات حرارة الهواء وتكسر وطفو الجليد بعيدًا، وأيضًا بسبب وجود المياه الأكثر دفئًا حول أنتاركتيكا [3]. تدور اقوى التيارات المحيطية في العالم حول القارة القطبية الجنوبية بأكملها. وفي بعض الأماكن، تتوجه المياه الدافئة نسبيًا (1-2 درجة مئوية؛ أي ما يعادل 34-36 درجة فهرنهايت) نحو الجروف الجليدية [4]، وتكون درجة حرارة المياه دافئة بما يكفي لإذابة الجليد عند ملامستها له، ولكن أهذا حقيقي؟
ونظرًا لأن قاع البحر حول القارة القطبية الجنوبية مليء بالوديان الضيقة والعميقة، فقد تُوجه الأخاديد المياه الدافئة نحو الجليد، على غرار الزلاقات المائية التي توجهك إلى حوض السباحة. وإذا تمكنت التيارات من التدفق تحت الجروف الجليدية، فقد يؤدي ذلك إلى زيادة معدل الذوبان من الأسفل. فكلما أصبحت الجروف الجليدية أقل سمكًا، كلما انزلق الجليد بشكل أسرع وانخلع من موضعه في أنتاركتيكا.
ولكن من الصعب على التيارات الدافئة أن تتسرب إلى أسفل الجروف الجليدية العائمة. فحتى في أقل أجزائها سماكة، لا تزال هذه الجروف تصل إلى عمق 250-500 متر في المياه. تخيل أن المحيط غرفة وسطح المحيط سقفها: سينخفض السقف فجأة بمقدار 250-500 متر حيث تبدأ الجروف الجليدية. وبسبب هذا التغير في الارتفاع يصعب على التيارات أن تتدفق تحت هذه الجروف. ففي غرفتنا الخيالية، قد يضطر الأشخاص الذين يرغبون في الذهاب إلى ما تحت السقف المعلق إلى الانحناء أو حتى الزحف لتحقيق ذلك، ويفاضل الأشخاص بين الطريقتين للقيام بذلك. وبالمثل، هناك أنواع مختلفة من التيارات. فهناك تلك التي تبقى قريبة من الأرض وتغوص تحت العوائق، وتلك التي لا تتمكن من فعل ذلك. ولكن ما نوع التيارات الموجودة حول القارة القطبية الجنوبية؟ وهل المياه الدافئة أصبحت قريبة بما يكفي من الجليد لإذابته؟ هناك عدة طرق لاكتشاف ذلك.
معرفة مدى سرعة ذوبان الجليد وسبب ذوبانه
يبدو أنه يُمكننا بسهولة أخذ سفينة أبحاث والإبحار إلى أنتاركتيكا ومراقبة التيارات مباشرة. ولكن هناك عدة أسباب لا تجعل ذلك الأمر سهلًا. فالطقس هناك سيئ والمحيط مُغطى بالجليد البحري خلال فصل الشتاء مما يُهدد سلامة السفن والأطقم. ومن ثمَّ فإن البيانات المأخوذة من سفن الأبحاث تكون موجودة فقط في مواقع مختارة لفترات زمنية قصيرة وفي فترة الصيف فقط.
وتُعتبر الأجهزة التي تبقى في المحيط لفترات زمنية طويلة هي البديل لذلك (الشكل 2). تُثبت المراسي في موقع ثابت على قاع المحيط، مما يُتيح إجراء قياسات في هذا الموقع على وجه التحديد. وتنجرف العوامات مع التيارات؛ وبالتالي فهي توفر البيانات فقط في حالة انجرافها مع التيارات. كما يُمكن تثبيت الأجهزة على الفقمات، مما يوفر البيانات أينما تسبح الفقمات. تُشبه الطائرات الشراعية الغواصات الصغيرة وتتحرك ببطء، ويُمكن التحكم فيها عن بُعد عبر المياه، ولكنها تحتاج إلى سفينة أبحاث بالقرب منها. وحتى بالنسبة للأجهزة، من الخطر أن تكون قريبة للغاية من حافة الجليد، فعادة ما يحتاج الأمر للمهارة والحظ لنشر هذه الأجهزة واستعادتها!
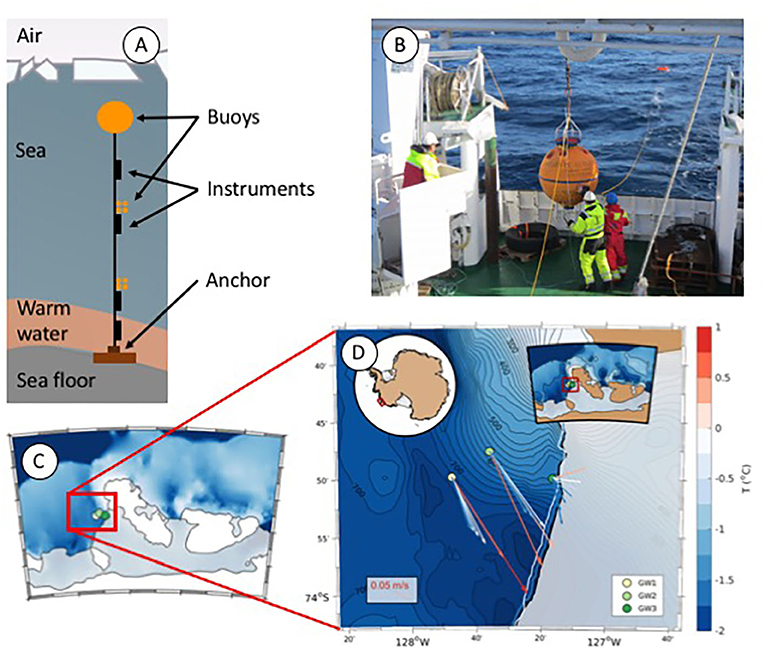
- شكل 2 - (A) مرساة في المحيط.
- يُظهر الشكل المرساة المُثبتة التي تحافظ على البقاء في المكان عينه والعوامات التي تبقيها في وضع مستقيم، والأجهزة المختلفة لقياس درجة حرارة المياه وكمية الملح الموجودة فيه واتجاه التيارات وسرعتها. (B) يُنشر المرسى فوق مؤخرة سفينة أبحاث. تُعتبر الكرة البرتقالية الكبيرة المعلقة على الرافعة عوامة تحمل أجهزة قياس التيارات وتحافظ على المراسي في المياه. ويُمكنك رؤية أجزاء أخرى من المرسى تطفو في المياه خلف سفينة الأبحاث. (C) خريطة مواقع المراسي الخاصة بنا (مثل الشكل رقم 1B، لكن تم تدويرها فقط). (D) النتائج المأخوذة من المراسي الثلاث لدينا: تبين الأسهم الاتجاه الذي تتدفق فيه التيارات وتُظهر الألوان درجات حرارة تلك التيارات.
يظل الأمر مثيرًا للاهتمام حتى النهاية: هل سنعثر على الأجهزة مرة أخرى ونعيدها على متن السفينة، وهل كانت تُسجل بالفعل طيلة الفترة الزمنية التي كانت فيها في المحيط أم لا؟ لا يُمكن قراءة البيانات من الأجهزة إلا عند إعادتها بأمان على متن السفينة.
وتتمثل الطريقة الثانية لفهم التيارات الدافئة والجروف الجليدية في محاكاة النظام عن طريق بنائه في صورة مصغرة (تخيل نموذجًا للسكك الحديدية)؛ ثم يُمكننا، بعد ذلك، تغيير أشكال الجروف الجليدية أو الأخاديد في نموذجنا، على سبيل المثال، لفهم تأثير كل تغيير على التيار الحالي في العالم الحقيقي.
القياس مباشرة في المحيط
لقد وضعنا المراسي، باستخدام أجهزة يُمكنها إعلامنا بدرجة حرارة المياه واتجاه التيارات المحيطية وقوتها، في ثلاثة مواقع على مدى عامين: موقع في مقدمة الجرف الجليدي وموقعان على طول الأخدود الذي يوجه المياه نحو الجرف الجليدي. أظهرت البيانات المأخوذة من اثنين من المراسي الموضوعة وجود مياه تتدفق نحو الجرف الجليدي. وأظهر المرسى الثالث، الأقرب إلى الجرف الجليدي، دوران التيار قبل الوصول إلى الجرف الجليدي. وهذا يعني أن تيار المياه الدافئة لا يمتد مباشرة تحت الجرف الجليدي، بل ينعطف ويتدفق بدلًا من ذلك على طول الجزء الأمامي من الجرف الجليدي قبل أن يتدفق مرة أخرى إلى المحيط المفتوح.
لذا، فإن الجليد لا يذوب بالقدر نفسه حين يتدفق التيار تحت الجرف الجليدي.
نمذجة التيارات المحيطية في عالم مُصغَّر
في مختبر بمدينة جرونوبل بفرنسا، وجدنا تفسيرًا لسبب دوران التيار (الشكل رقم 3). حيث استخدمنا حوض سباحة دوارًا بقطر 13 مترًا لمحاكاة دوران الأرض. وبنينا أخدودًا بلاستيكيًا لتمثيل مجال اهتمامنا في أنتاركتيكا، ثم قمنا بضخ المياه في الأخدود لتوليد تيار. وجرى تغطية نهاية الوادي “بجرف جليدي” بلاستيكي حيث يُمكننا رفعه وخفضه وإمالته لخلق ظروف مختلفة في إطار التجربة. وجعلنا التيارات مرئية بخلط جزيئات بلاستيكية صغيرة في المياه وإنارتها بالليزر. ومن خلال تتبع أماكن انتقال الجسيمات بين صور الجسيمات المضاءة بالليزر، يُمكننا إعادة نمذجة التيارات.
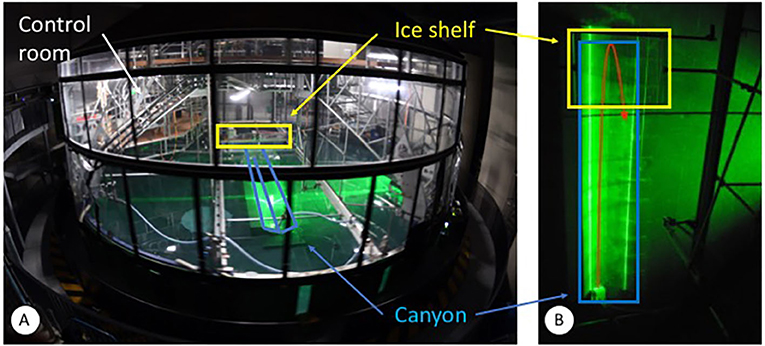
- شكل 3 - (A) منظر خارجي لحمام السباحة الدوار بقطر 13 مترًا.
- لاحظ غرفة التحكم التي تدور مع المسبح، بالإضافة إلى “الجرف الجليدي” و“الأخدود” في المياه. (B) منظر علوي لنموذج الأخدود (باللون الأزرق) تحت الجرف الجليدي (باللون الأصفر). يتدفق التيار (باللون الأحمر) تحت الجرف الجليدي، ثم يلتف ويتدفق مرة أخرى.
بالنسبة للجرف الجليدي الذي يبدأ بمنحدر شديد، فإن التيار يوقفه عند حافة الجليد ولكنه يضطر إلى الالتفاف دون التدفق تحت الجليد. وبوجود كمية قليلة للغاية من المياه تحت الجليد، يحدث قليل من الذوبان. ومع ذلك، إذا تغير شكل الغطاء الجليدي بحيث يبدأ من سطح البحر ثم يصل تدريجيًا إلى عمق أكبر في المياه، فسيغدو من السهل على التيارات التحرك تحت الجليد، وبهذا الشكل يُصبح الجرف الجليدي عُرضة للذوبان بشكل أسرع. وإذا تغير هيكل التيار بحيث يتحرك الجزء السفلي منه فقط، فقد يحدث الأمر بشكل مختلف، وقد يُتيح ذلك الأمر لكميات أكبر من المياه الوصول إلى الجرف الجليدي.
التنبؤ بالمستقبل
الآن بعد أن عرفنا كيف يؤثر شكل الجروف الجليدية وكذلك نوع التيارات التي تقترب منها على سرعة ذوبان الجليد، يُمكننا الاستفادة من ذلك للمساعدة في التنبؤ بمستوى سطح البحر في المستقبل. ويُمكن للنماذج الحاسوبية، المشابهة لتلك المستخدمة في التنبؤات الجوية، أن تحسب بدقة أين تذهب التيارات المحيطية ومقدار الجليد الذي تتسبب في إذابته. وستصبح هذه المعلومات بعد ذلك جزءًا واحدًا من أحجية التنبؤات المناخية التي يُمكن أن تساعدنا في اتخاذ قرارات سياسية لمنع تغير مستوى سطح البحر والتكيف معها.
مسرد للمصطلحات
الغطاء الجليدي (Ice Sheet): ↑ توجد كتل جليدية كبيرة تغطي جرينلاند وأنتاركتيكا. تتشكل مع تساقط الثلوج والأمطار ويزداد تراكم الجليد وقد يصل سمكه إلى 5 كيلومترات.
الجروف الجليدية (Ice Shelves): ↑ تتدفق الصفائح الجليدية الضخمة على اليابسة وتطفو على سطح المحيط، ولكنها لا تزال متصلة بالجليد الواقع على الأرض. وقد يصل سمكها إلى عدة مئات من الأمتار.
الجليد البحري (Sea Ice): ↑ الجليد الذي يتشكل حين تتجمد مياه البحر. وهو يطفو على المحيط (يُرجى الاطلاع على الرابط التالي https://kids.frontiersin.org/article/10.3389/frym.2019.00079).
ارتفاع مستوى سطح البحر (Sea-Level Rise): ↑ متوسط ارتفاع مستوى مياه المحيط على المدى الطويل. يُسهم ذوبان القمم الجليدية في أنتاركيتكا وجرينلاند في ارتفاع مستوى سطح البحر.
تغير المناخ (Climate Change): ↑ يُقصد به التغير طويل المدى الذي يطرأ على أنماط المناخ مثل درجات الحرارة وهطول الأمطار والتيارات المحيطية ومستويات سطح البحر. يحدث تغير المناخ بشكل طبيعي ويؤدي إلى حدوث فترات دافئة وباردة، ولكن في الآونة الأخيرة، تسبب العنصر البشري في إحداثه.
التيار المحيطي (Ocean Current): ↑ متوسط حركة الماء في المحيط. قد تتسبب عمليات مختلفة في حركة التيارات المحيطية، مثل: الرياح أو اختلافات الكثافة في الماء (يُرجى الاطلاع على مقالتي عبر الرابط التالي: https://kids.frontiersin.org/article/10.3389/frym.2019.00085).
المراسي (Mooring): ↑ أجهزة قياس بحرية تُثبَت في قاع البحر وتبقى لفترة زمنية معينة في المحيط لجمع البيانات. يُمكن أن تقيس المراسي التيارات البحرية ودرجة حرارة مياه البحر ومستوى ملوحتها.
النموذج الحاسوبي (Computer Model): ↑ يُعد طريقة لتمثيل العمليات الفيزيائية على جهاز الحاسوب حيث يسمح للعلماء بفهم البيئة أو التنبؤ بتأثير التغيرات المستقبلية. وتعتبر توقعات الطقس مثالًا على ذلك. للحصول على تفسير معقول، يُرجى الرجوع إلى الرابط التالي https://kids.frontiersin.org/article/10.3389/frym.2019.00161.
إقرار تضارب المصالح
يعلن المؤلفون أن البحث قد أُجري في غياب أي علاقات تجارية أو مالية يمكن تفسيرها على أنها تضارب محتمل في المصالح.
شكر وتقدير
يُود المؤلفون شكر K. Daae لمساعدتها في إعداد الرسوم التوضيحية. تَم دعم تجاربنا من خلال برنامج 2020H التابع للاتحاد الأوروبي من خلال منحة Hydralab-plus، بعقد رقم 654110. ونُقدر، مع امتناننا، مِنَح الدعم المُقدمة للمؤلفين على النحو التالي: التعليم والعلوم الطبيعية من مجلس البحوث النرويجي من خلال المنح 267660 (TOBACO) و231549 (WARM)؛ AW من مجلس البحوث السويدي والمؤسسة السويدية للبحوث الاستراتيجية من خلال مركز الروبوتات البحرية السويدية (SMaRC)؛ ونشكر I. Fer على إقراضنا أجهزة 1GW, 2GW.
مقال المصدر الأصلي
↑ Wåhlin, A. K., Steiger, N., Darelius, E., Assmann, K. M., Glessmer, M. S., Ha, H. K., et al. 2020. Ice front blocking of ocean heat transport to an Antarctic ice shelf. Nature 578:568–71. doi: 10.1038/s41586-020-2014-5
المراجع
[1] ↑ Wåhlin, A. K., Steiger, N., Darelius, E., Assmann, K. M., Glessmer, M. S., Ha, H. K., et al. 2020. Ice front blocking of ocean heat transport to an Antarctic ice shelf. Nature 578:568–71. doi: 10.1038/s41586-020-2014-5
[2] ↑ Glessmer, M. S. 2019. How does ice form in the sea? Front. Young Minds 7:79. doi: 10.3389/frym.2019.00079
[3] ↑ Shepherd, A., Fricker, H. A., and Farrell, S. L. 2018. Trends and connections across the Antarctic cryosphere. Nature 558:223–32. doi: 10.1038/s41586-018-0171-6
[4] ↑ Assmann, K. M., Darelius, E., Wåhlin, A. K., Kim, T. W., and Lee, S. H. 2019. Warm circumpolar deep water at the western getz ice shelf front, Antarctica. Geophys. Res. Lett. 46:870–8. doi: 10.1029/2018GL081354