Abstract
Your friends can influence you in ways you may not realize. They can influence the way you think and behave, your likes and dislikes, what you buy, how well you do in school. Information on who you know is useful to scientists because we can use it to better understand how ideas, or in some cases diseases, spread. Scientists and mathematicians can use data and advanced mathematics to make educated guesses about how likely something is to occur. For example, we can predict your likelihood of being friends with another person given just a few pieces of information, like what school you attend, your hobbies, and who you know! In this article, you will learn about some of the tools to become a network scientist and make your own mathematical predictions about friendships!
Can Scientists Predict Who Your Friends Are?
It has been said “it is not what you know but who you know that matters”. You and your friends probably have a lot in common. Can you make a list of your commonalities? What are your shared interests and traits? Do you go to the same school or play on the same team? Do you live in the same neighborhood or city? Do you have friends in common? You would probably answer yes to at least some of these questions for each of your close friends. You may not realize it, but you and your friends also share all kinds of information, attitudes, and behaviors about school. Scientists have found that the people around you, what they know and think about school, and how they behave can influence your academic future [1]. In other words, your friends influence your habits and how well you do in school. On the other hand, how well you do in school can influence who your friends are [2]! It turns out that social scientists and mathematicians can even predict who your friends are, to some extent!
What is a Social Network?
Scientists who study networks use mathematical equations to graph and measure behaviors and relationship qualities, such as who you ask for help and the closeness of friends [3]. A social network is a web of personal connections, in which people exchange knowledge and resources. The amount of knowledge and resources exchanged in a network depends on the patterns and quality of the relationships within the network [4]. If you want to learn more about network science, read this Frontiers for Young Minds article.
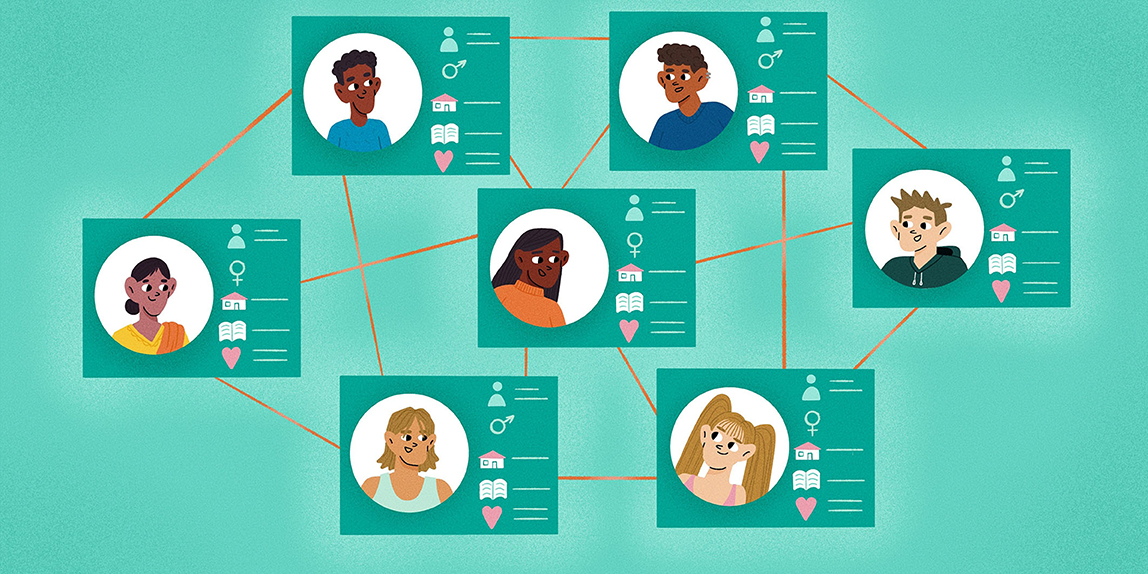
We can also visualize social networks by creating graphs. In social network graphs, people are represented by colored circles called nodes. The colors of nodes can represent characteristics of the people in the network, such as grade level, age, or gender. Connections between people (for example, friendships) are represented by lines between nodes, which are called edges (Figure 1).
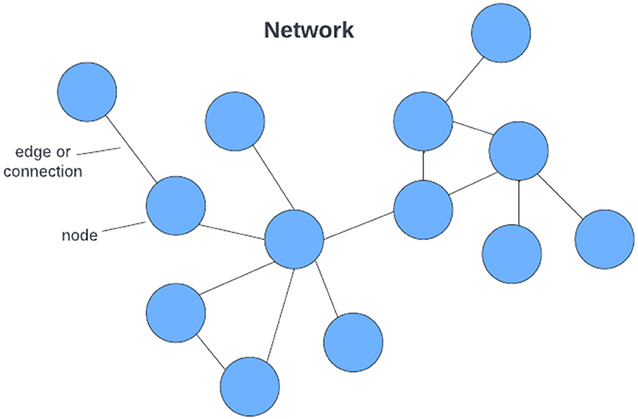
- Figure 1 - An example of a sociogram or social network graph.
- Each blue dot is a node that represents a student, and the lines between students (edges) indicate that they are friends.
Predicting Friends Using Advanced Math and ERGMS
An exponential random graph model (ERGM) is an advanced mathematical tool that predicts whether two people might become connected based on the characteristics of a network. The ERGM compares all possible, random connections in a network to find out how likely it is two people will become connected at some point in the future. So basically, ERGM is a tool for predicting people connections.
With our simplified model, you can make your own predictions based on just five questions. Got someone in mind? Great! Let us try it!
How Dense is Your Network?
Can you think of an athletic team or club you are part of in which most people are friends with each other? This would be a dense network, where most of the people who could be friends actually are. Density is described in a percentage value calculated as the number of real connections (ties) in a group (network) divided by all possible connections (ties) in the group (network). For example, both networks in the image below (Figure 2) have 50 nodes, but the network on the right has far more connections (lines) between nodes, so it is denser!
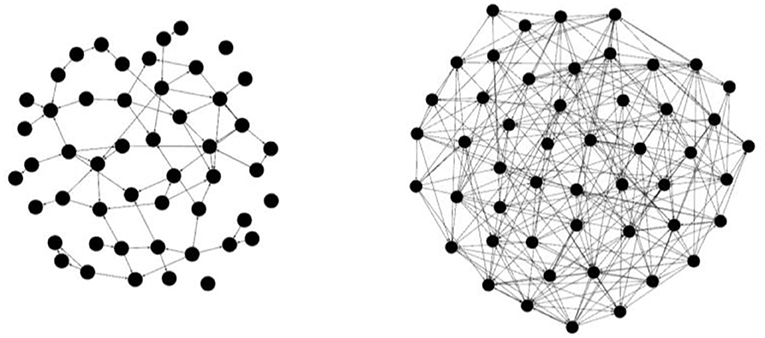
- Figure 2 - (Left) An example of a social network with less density of ties.
- (Right) An example of a social network with more density of ties.
Density is important in ERGM calculators because it can increase or decrease the probability that two people will connect. In a network with a high density value, the probability of connection between two individuals will be much higher. In other words, in a very dense network, it is much more likely any two people in the network will eventually connect with each other.
How Many Mutual Friends Do You Have?
Can you think of any of your friends who are also friends with each other? This is triangulation—when people are friends with their friends’ friends. You are more likely to be friends with their friends because of it. In a network graph, these connections (lines) make triangles shapes appear, which is why it is called triangulation! When there are lots of triangles in a network graph, you get a high triangulation value. A high triangulation value would increase the probability two people will eventually become connected, whereas a low triangulation value would not so much.
Do Your Friends Call You a Friend?
Let us say we ask you who your best friend is, would that person also call you their best friend? If so, that is what we call reciprocity. Here is another example: in a classroom network, maybe one student lists you as a person they go to for help, and you also list them as someone you go to for help. In both situations people “send” connections to each other. Because reciprocity is a form of increased connectivity in a network, it is an important value for ERGM calculators. As with density and triangulation, a high reciprocity value would increase the probability two people will eventually become connected.
Do You Go to Your Friends for Advice?
If we asked you to make a list of your friends, and then to make a list of the people you go to for homework help, and a list of the people you go to for support during a tough time, you probably have at least one friend who would be on more than one of those lists. According to network scientists, you would have many kinds of connections (“edges”) with that one friend. When you have several kinds of connections (“edges”) with one individual, it is called the edge effects phenomenon. The term edge effects basically means that if you spend a lot of time with a friend, it is likely you are connected to them in multiple ways. The more edge effects in a network, the higher the likelihood two people will eventually become connected, making this another important value for ERGM calculators.
Do You Share Characteristics?
Have you heard the expression “birds of a feather, flock together”? Do you notice you and your friends often share likes, dislikes, hobbies, maybe even beliefs? This describes homophily when people have connections with others like themselves. So, when there is more homophily in a network, people tend to make more connections. Like the other three network characteristics (density, triangulation, reciprocity, and edge effects) homophily can increase or decrease the probability two people will eventually become connected, which is why network scientists like to include It in ERGM calculators.
Predicting Friends—How Does It Work?
Estimates from ERGMs are reported in units of “log-odds” (the logarithm of an odds ratio). Mathematicians use log-odds because it is an easy tool for combining multiple variables of probability.
Odds are the probability of success (winning a game between you and me) over the probability of failure (losing the game). For example, let us say there is a 1-in-4 (0.25) chance you will win (success), and there is a 3-in-4 (0.75) chance you will not win (failure). To get your odds for winning, we divide the chance of success (0.25) by the chance of failure (0.75); so, we get (0.25/0.75).
Now, let us say that I am not as good at the game as you are, so the chance I will win is (0.10), and the chance I will not win is (0.9). To get my odds for winning, we divide my chance of success (0.10) by my chance of failure (0.9), so we get (0.10/0.9).
Next, to compare your and my chances of winning, we need to combine the odds by creating a ratio, dividing your odds by my odds. The odds ratio between our likelihood of winning the game is written as (0.25/0.75)/(0.1/0.9) which simplifies to 3. In other words, the odds you will win is 3 times bigger than the odds I will win.
You may notice that odds ratios are asymmetrical. On a typical number-line, the lowest number is negative infinity, the highest number is positive infinity, and the “center” number is zero. However, for odds ratios, the lowest possible number is zero, the highest number is positive infinity, and the “center” number is one!
Think about it like this, if I am twice as likely to beat you at tennis, you are half as likely to beat me. In terms of a ratio, these are equivalent, but numerically they (2 and 0.5) are different distances from 1 on a number line, and 1 would mean we have equal chances of beating each other. So, we take the log of the odds ratio. The log function has many features but the one that is most relevant to us is that log of 1 is 0 and for positive x we know log(x) = –log(1/x). For example, the log of 2 is 0.69 and the log of 1/2 is -0.69. So, if you calculate the odds ratio as the probability of me winning vs. the probability of you winning or the other way around, by taking the log we get the same numbers. They just differ by the positive/negative sign. In other words, they are now equal distances from 0 on a number line.
So, taking the log of the odds shifts equal chances to 0, and allows for a symmetric estimate of the odds. Mathematicians use log-odds because it is an easier tool for combining multiple odds ratios, which is what our interactive calculator will do. In our case, we can use “points” in place of log-odds.
Using the Interactive Calculator
We chose specific values for the interactive calculator (model) below based on typical social network outcomes. For example, the odds people with friends in common will be friends is high (in this case tripling the chances you would be friends), even in commonly less dense networks, like friendship networks.
The numbers in the interactive calculator (model) below (Figure 3) can be changed depending on which kinds of similarity the modelers think are more important for making friendship in the specific network. Choices like “4 points for mutual advice, 1 point for same gender identity” are just that, choices, rather than rules set in stone. A big part of applied mathematics is adjusting a model to make it represent reality more accurately. It is true that certain kinds of similarity have been found in the research to contribute more to friendship in large school-based networks (so we included some of them below). For example, if you have friends in common your chances are highly likely to be friends, and if you go to advice from someone at school you are even more likely to be friends. However, the actual values are hypothetical.
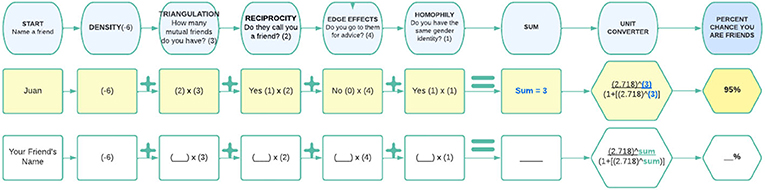
- Figure 3 - (Top Row) An example of how to use the interactive calculator for determining the percent chance you and Juan form a friendship.
- (Bottom Row) The interactive calculator for determining the percent chance you and another person form a friendship.
Friendship “Points”
Imagine two people going to the same school, you and me! Large school-based friendship networks tend not to be very dense, so we will start with an assumption of (low) network density which gives us negative six points. Let us pretend we have 2 mutual friends (triangulation), which adds 6 points back to the score. You and I both say each other is a friend (reciprocity), which adds 2 more points to our score. However, neither of us go to the other for advice (edge effects), which means we do not get those points added to our score. Now, let us also say we both share the same gender identity (homophily), which adds 1 more point to our score. To add up our total score, we have −6 + 6 + 2 + 0 + 1 = 3.
Calculating Odds
Once we have the sum (3) of your friendship points, this is the log-odds of the likelihood we would be friends. To convert that into a friendly number (percent chance), we need to calculate the reverse log. The formula in the interactive calculator does just that! It converts your log-odds into percent chance. To do that we raise Euler’s number (a mathematical constant ~equal to 2.718) to the exponent of the sum of friendship points, divided by 1 plus Euler’s number raised to the exponent of the sum of friendship points. When we plug the numbers from our example into the formula below, we end up with 0.95, or 95% chance we would be friends.
Your Turn!
Depending on your answers to the questions below, the final ERGM point value will change. We transform the point value into a percentage when you were done to make it easier in a real-life situation. If the percentage is high, above 50%, it is likely you are friends. If the percentage is low, below 50%, it is not likely you are friends.
Now, you can use our interactive ERGM calculator on your own to find the chances you would be friends with a real person you know!
Advanced Moves
If you want to try something a little more advanced, try playing with the model to change those numbers and see what happens—which values produce the most accurate actual networks? This is how real-life modeling works, after all.
It is important to remember that our example of a whole school-based friendship network is not very dense. But let us say you wanted to try this again with a smaller, denser network like a specific club or extracurricular program, like jazz band or speech and debate club. It would be difficult to know every single person in your school, let alone be friends with everyone. On the other hand, it would be much easier to know everyone in a small group and be friends. In the case of a small group or club, you will likely have a positive density coefficient in the calculator (like 3 or 6 points, instead of negative 6). You could even estimate the actual density of a small network by calculating the real existing friendship connections in the group divided by the total number of connections possible among individuals in the group.
Now that you know how to do it, try mapping out your own social network and use your own density numbers in the calculator! You will notice that as density increases, so does the percent chance of being friends! Now, you are really doing network science!
Conclusion
So, you might be thinking, why would anyone want to predict who my friends are? Well, it turns out there is a lot of uses for this kind of information. The ability to accurately predict your social connections is helpful for finding you “friends” on social media apps, and a juicy opportunity for online retailers, political campaigners, or those who are hoping to spread false information, to name a few. Let us just say, if the app is free, then you and your social connections (social networks) are the product. Phishing scams also manipulate your social networks to spread computer viruses, downloading all your contacts and sending them a virus as if you were sending the email. Epidemiologists use large scale network prediction models and contact tracing to make decisions on how to best protect you from the spread of infectious disease. But friends do not just swap germs and computer viruses, they exchange ideas and attitudes about the world. You influence each other’s behaviors, including exercise, interests, truancy, and grades in school. That is not to say that your friends need to be at the top of the class for you to succeed in life, but based on math, it certainly will not hurt to stay connected with your friends who are doing well in school. Remember, it is also the quality of your relationships that matter. Now you know, mathematically speaking, who you know matters!
Glossary
Social Network: ↑ A collection of people (nodes) and the connections (ties) between those people (nodes).
Nodes: ↑ Circles representing individual people in social network graphs.
Edges: ↑ Lines connecting nodes (people) in social network graphs.
ERGM: ↑ Advanced math tool for predicting people connections in social networks.
Density: ↑ Percentage value of connectivity in a social network.
Triangulation: ↑ The tendency of people to be friends with the people their friends are friends with.
Reciprocity: ↑ The tendency of people to “send” connections back to people who sent them one first.
Homophily: ↑ The tendency of people to be friends with people who are similar to themselves.
Conflict of Interest
The authors declare that the research was conducted in the absence of any commercial or financial relationships that could be construed as a potential conflict of interest.
References
[1] ↑ Bourdieu, P., and Passeron, J. C. 1977. Reproduction in Education, Society and Culture. New York, NY: Oxford University Press.
[2] ↑ Ito, M. 2010. Hanging Out, Messing Around, and Geeking Out: Kids Living and Learning With New Media. Cambridge, MA: The MIT Press.
[3] ↑ Lin, N. 1999. Building a network theory of social capital. Connections 22: 28–51.
[4] ↑ Daly, A. J., Moolenaar, N. M., Bolivar, J. M., and Burke, P. 2010. Relationships in reform: the role of teachers’ social networks. J. Educ. Administr. 48:359–91. doi: 10.1108/09578231011041062