Abstract
Across the world, our wildlife is under threat. Global warming, farming, fishing, buildings, and roads are eating up or damaging wild spaces where animals live. Animals like the vaquita, the world’s rarest marine mammal, are on the brink of extinction. To look after the wildlife that we still have, conservationists need to know how many animals there are, and how populations are changing over time. But how do you work out how many gibbons are left in the rainforest, or how many porpoises there are in the sea, if you cannot see them? We work out population sizes by recording and counting the calls or songs animals make. We then use this information to help conservationists make better decisions about how to look after some of our rarest and most endangered species, now and into the future.
How Many Animals?
People across the world are working to protect wild animals. To do this, they need to work out how many animals are alive now and whether their numbers are increasing or decreasing. Scientists must find ways to count animals at a given place and time. But counting animals is actually much harder than it seems, and scientists are constantly searching for better ways to gather the information they need. One relatively recent method for counting animals is called passive acoustic monitoring (PAM) density estimation (DE), so PAMDE. This method enables scientists to count animals by listening to the sounds they make [1]. Many animals use sounds to communicate or to sense the environment around them.
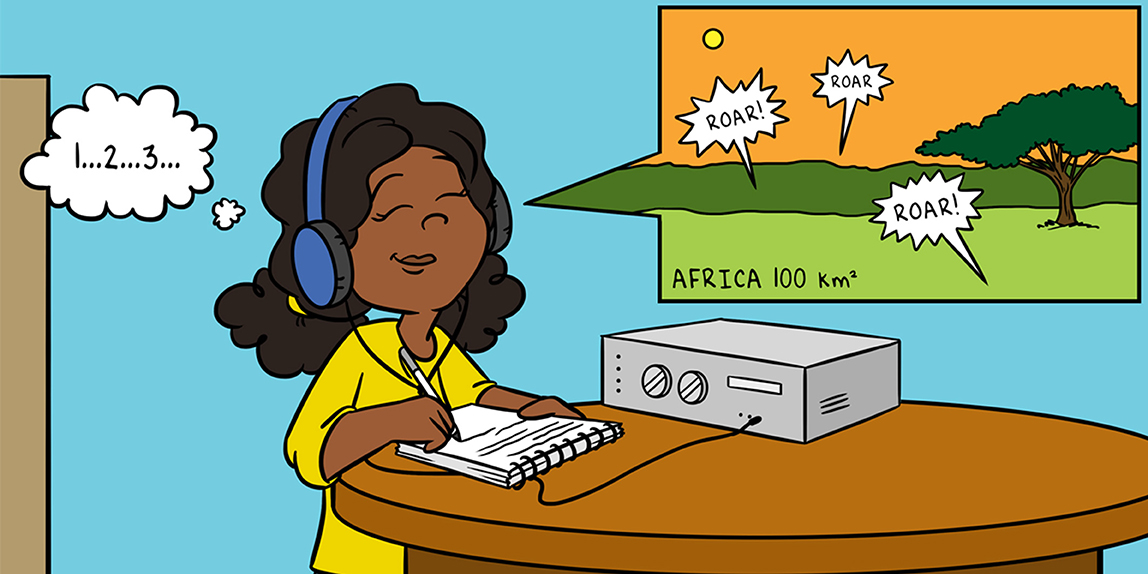
If you were to enter a room with your eyes closed, you could probably guess the number of people inside without even thinking about it. Your brain could work this out by using information on the overall sound level in the space, and the knowledge that every person has a unique voice. We can use the same idea to estimate numbers and density of animals in certain situations. Density is the number of animals in a particular area. However, listening to sounds in a small room is much easier than hearing calls from animals that might be a long way away. But if you know the size of the area you want to study, you can count animals in a small part of that area and use your results to estimate the total number of animals in a larger space. For example, if you are trying to determine how many lions live in 100 square km of the African savannah, you could count all the lion roars in 5 square km, then multiply your answer by 20 to estimate how many lions there are in total.
But how do you know if the five roars you counted came from five different animals or from just one noisy one? Well, if you know how often lions tend to roar, you can make a good guess! It is also important for scientists to become experts at recognizing the different sounds made by the animals they are studying. Otherwise, for example, they might think an African wild dog’s bark was actually made by a hyena. How good we are at recognizing a sound as a sound of interest is fundamental. If we treat every single detected sound as a sound of interest, when some of these were not produced by the animal we are studying, we could overestimate how many animals there are.
“Seeing” Sound
Sound waves can travel through solids, air, and water. A sound can be described by how long it lasts (duration), how many times a sound wave is produced per second (frequency), and how loud it is (intensity). Low-frequency sounds, such as a blue whale song, travel further than high-frequency sounds. The distance the sound travels is also affected by what it is traveling through. For example, sound travels further through water than it does through air. In fact, the distance over which a sound can be detected is a combination of the substance it travels through, the intensity of the sound, and the frequency of the sound (Figure 1).
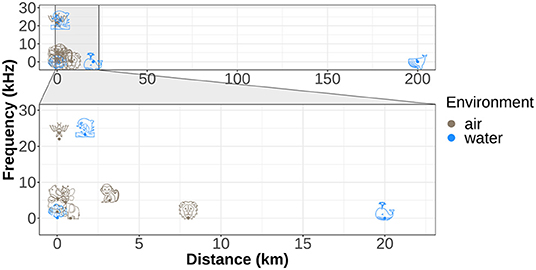
- Figure 1 - Animal species produce a wide variety of sounds.
- These sounds are of different frequencies and can travel different distances. Examples on this graph include insects, amphibians, fish, birds, elephants, primates, carnivores, dolphins, and whales. You can see that whale sounds, for example, are low frequency and travel long distances, while bats have high frequency and travel short distances. How far a sound travels will influence how we can use it to estimate density.
A spectrogram is a visual representation that enables us to “see” sounds. It shows sound intensity and frequency over a given time (Figure 2). Each animal’s call makes a specific pattern on the spectrogram, and scientists can identify animals by studying the pattern of these sounds. We can even tell one species from another! For example, the songs of two fin whales will look similar to each other, but very different from, say, the song of a blackbird. Just as we can tell the difference between whales, birds, and fish by how these animals look, we can also tell them apart by their sounds, by studying their spectrograms.
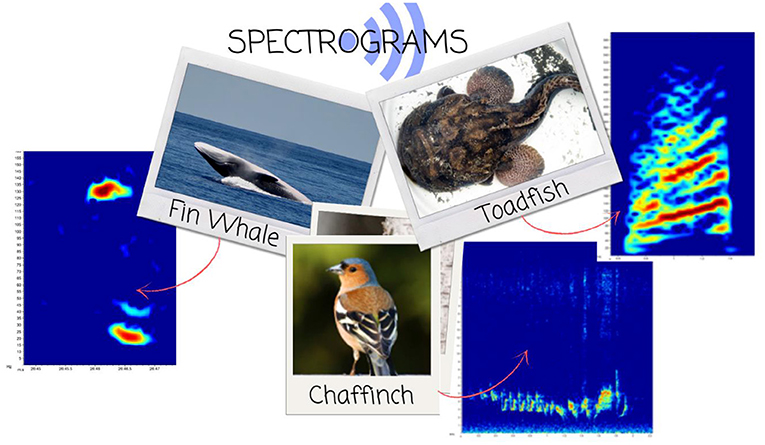
- Figure 2 - Fin whale, toadfish, and chaffinch photos and their spectrograms.
- A spectrogram is a representation of sound, in the x-axis you have time and in the y-axis you have frequency, and the colors represent intensity. Here darker colors (yellow/red) represent higher intensity. (Photograph credits: fin whale IMAR/Azores Whale Lab; toadfish Clara Amorim; chaffinch: Creative Commons CC BY-SA 4.0 (https://commons.wikimedia.org/wiki/File:Fringilla_coelebs_chaffinch_male_edit2.jpg, image cropped for composition). Spectrogram credits: André Matos. Audio 1. This fin whale recording from the Azores, Portugal, was used to make the fin whale spectrogram (Recording credits: IMAR—Instituto do Mar / Azores Whale Lab). https://youtu.be/wY8G79J5Ac4. Audio 2. This chaffinch recording from the Companhia das Lezirias, Portugal, was used to make the chaffinch spectrogram (Recording credits: Ana Leal). https://youtu.be/eV0Q5C6R8uc. Audio 3. This toadfish recording from the Tagus estuary, Portugal, was used to make the toadfish spectrogram (Recording credits: Paulo Fonseca). https://youtu.be/myHpOqvGdq4.
How Does Pamde Work?
To use PAMDE, we must first decide on the area of land or sea we are studying. Then, we need to decide on a suitable way to survey it. This usually involves placing several microphones or hydrophones (underwater microphones) around our area of study. We might place these sensors on the ground in a grid pattern and leave them recording for several days, weeks, or months. Alternatively, we might tow sensors from moving vehicles, such as boats, gliders, or drones.
A project called the SAMBHA Project surveyed endangered harbor porpoises in the Baltic Sea, to help conservationists understand how to protect this rare species [2]. A total of 300 hydrophones were placed in the water to record sounds made by harbor porpoises for 1.5 years. All together, they produced 300 × 1.5 years = 450 years’ worth of recordings! Obviously, one person would not be able to listen to all of this! Luckily, we can use computers to identify the sounds for us. We can use a technology similar to the one used by mobile phones to recognize faces. This technology helps us determine how many porpoise calls are recorded over a particular length of time. Next, we use our data to figure out how many individual porpoises are present in our study area.
Our sound-detection technology tells us whether each sound we record belongs to our animal of interest. The sounds that we detect are a mix of the sounds made by the animals we are studying and false positives, which are other sounds that are mistakenly identified as our animals’ sounds. False positives can be for example sounds made by other animals or man made. We must work out the number of false positives to make sure our final estimates are accurate.
We also need to know the size of the area that the sensors are sampling. Detecting 100 sounds in 10 minutes might correspond to low porpoise density if the sounds come from up to 10 km away. But if we only hear sounds that are up to 10 m away, then 100 sounds in 10 min would probably indicate a high density of porpoises. Estimating the area each sensor covers is hard. To help, we use something called a detection function, which helps us work out how likely we are to hear a sound of interest at any given distance from the sensor (Figure 3). We can estimate the detection function using either a computer model of how sound moves [3] or by using data from studies of animals in known positions [4].
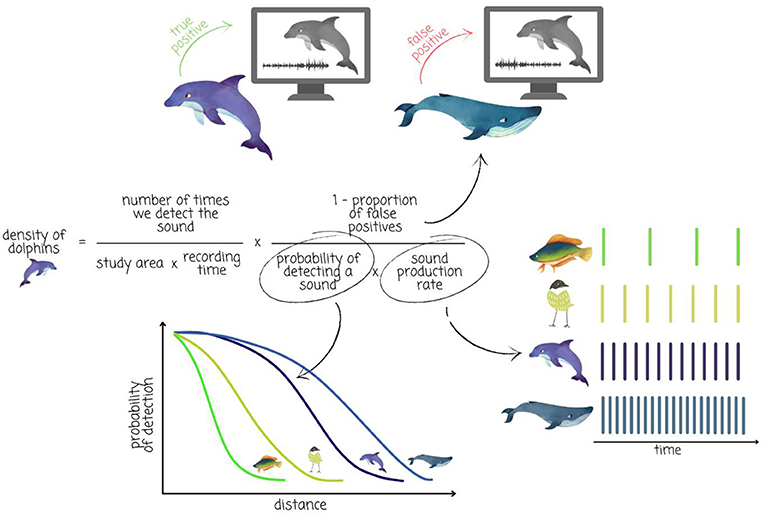
- Figure 3 - Estimating dolphin density by counting their sounds.
- For cue counting, we use the number of dolphin sounds detected in a specific area and over a specific time period. We convert these sounds into a dolphin density estimate. To get the density estimate, we must first estimate the probability of detecting a sound, the sound production rate, and the proportion of false positives. For illustration, we present the detection function and the cue rate of hypothetical fish, bird and whale besides those of the dolphin we are interested in.
Finally, sound production rate is fundamental. Imagine we wanted to figure out how many people were in your classroom by recording the number of words spoken. First, we would need to know how long your lesson is. Let us say it is 1 h. Then, we need to know roughly how many words each person in the room is likely to speak during an hour. If, on average, students speak 10 words per hour, and we record 300 words in total, we can estimate that there are 300/10 = 30 students. By getting the average word production rate, we can tie the total number of words back to the number of students. The same happens when using PAMDE to estimate animal density in the wild. However, working out how many “words” a whale produces in an hour might be much harder than doing so for your friends. This is a main topic of our current research2.
Putting It All Together
A variety of methods exists to estimate animal density from PAMDE. We will concentrate on a method called cue counting [2]. Using cue counting, we count the number of acoustic (sound) cues and convert them to animal density (Figure 3). Imagine you are estimating dolphin density in a large region. You have a load of sensors that can hear sounds within a circle of 1 km2 around each of them. Imagine you have 20 sensors, which you spread in a grid across the area of interest, covering 20 km2. You set your sensors to record for 10 days and identify 120,000 sounds that you think are made by dolphins. If a dolphin produces an average of 100 sounds per day, each dolphin will produce an average of 1,000 sounds in 10 days. So, you might think there were 120 dolphins there.
But what if you do not hear all the sounds made by every dolphin? Imagine you only hear half of all the sounds that each dolphin makes. If you missed half the sounds, you will have counted only half the number of dolphins. In our example, this means that there were actually 240 dolphins present, not 120. But we still need to account for false positives: the sounds that are not dolphins. Let us say that two in ten of the sounds were not actually made by dolphins, which means only eight in ten sounds were. In other words, of the 240 dolphins you think you counted, some were not actually dolphins at all. So, in the end, we only have 240 × 8/10 = 192 dolphins in 20 km2 which is the same as 9.6 dolphins per km2. We can put all these calculations together in a mathematical formula (Figure 3). You can do the maths if you want, but you do not have to!
Why Is It Important To Estimate Abundance?
Counting animal numbers is vitally important if we want to understand animal populations and how they change over time. This helps conservationists make better decisions about how to care for animals in the future. Using PAMDE has several advantages over visual surveys, in which people look for animals. Without disturbing the animals, we can survey continuously for long periods of time, which allows us to count animals at night, in bad weather, or in the sea or other remote places that humans cannot easily get to. As an example, by counting the numbers of vaquitas, which are small, endangered porpoises from the Gulf of California [5], PAMDE has helped scientists to understand how critical the state of their population is. These studies are helping persuade the government to pass laws to reduce illegal fishing practices that harm these rare porpoises, to prevent them becoming extinct. Valuable work indeed!
Glossary
Pamde: ↑ Passive acoustic monitoring density estimation, the use of sounds to estimate animal density. One example is cue counting.
Density: ↑ The number of animals per unit area. If you multiply a density by an area, you get the number of animals (abundance) in the area.
Spectrogram: ↑ A two-dimensional representation of sound, showing time on the x axis and frequency on the y axis, with color representing intensity1.
Hydrophone: ↑ A device akin to a microphone but that allows you to record sounds under water.
False Positive: ↑ A sound that was considered at first to be of the species of interest but turns out it is not. Could be a sound made by another species, or a man made, or just noise.
Detection Function: ↑ The probability of detecting an animal as a function of its distance to a detector. In PAMDE the detector might be say a human, a microphone, or a hydrophone.
Sound Production Rate: ↑ The mean number of sounds an individual produces per unit time. A fundamental quantity to estimate animal density from number of detected sounds.
Cue Counting: ↑ The process of counting animals by counting the number of cues (e.g., sounds, nests, dung, whale blows) they produce and converting it to population density.
Funding
This work was conducted under the auspices of the ACCURATE project, funded by the US Navy Living Marine Resources program (contract no. N3943019C2176). TM and CM thank partial support by CEAUL (funded by FCT - Fundação para a Ciência e a Tecnologia, Portugal, through the project UIDB/00006/2020).
Conflict of Interest
The authors declare that the research was conducted in the absence of any commercial or financial relationships that could be construed as a potential conflict of interest.
Footnotes
1. ↑ You can learn more about and play with spectrograms here https://musiclab.chromeexperiments.com/Spectrogram/.
2. ↑ For more info on this project, check out this site: https://accurate.st-andrews.ac.uk/.
References
[1] ↑ Marques, T. A., Thomas, L., Martin, S. W., Mellinger, D. K., Ward, J. A., Moretti, D. J., et al. 2013. Estimating animal population density using passive acoustics. Biol. Rev. 88:287–309. doi: 10.1111/brv.12001
[2] ↑ Carlén, I., Thomas, L., Carlström, J., Amundin, M., Teilmann, J., Tregenza, N., et al. 2018. Basin-scale distribution of harbour porpoises in the Baltic Sea provides basis for effective conservation actions. Biol. Conserv. 226:42–53. doi: 10.1016/j.biocon.2018.06.031
[3] ↑ Kusel, E. T., Mellinger, D. K., Thomas, L., Marques, T. A., Moretti, D., and Ward, J. 2011. Cetacean population density estimation from single fixed sensors using passive acoustics. J. Acoust. Soc. Am. 129:3610–22. doi: 10.1121/1.3583504
[4] ↑ Marques, T. A., Thomas, L., Ward, J., DiMarzio, N., and Tyack, P. L. 2009. Estimating cetacean population density using fixed passive acoustic sensors: an example with Blainville’s beaked whales. J. Acoust. Soc. Am. 125:1982–94. doi: 10.1121/1.3089590
[5] ↑ Jaramillo-Legorreta, A., Cardenas-Hinojosa, G., Nieto-Garcia, E., Rojas-Bracho, L., Hoef, J. V., Moore, J., et al. 2016. Passive acoustic monitoring of the decline of Mexico’s critically endangered vaquita. Conserv. Biol. 31:183–91. doi: 10.1111/cobi.12789