Abstract
Noise is defined as unwanted sound. Not only is noise unwanted, it is expensive and bad for human health. But what sounds like noise to one person might be a happy sound for someone else, so how do we study noise? This article explains how we try to understand and measure noise. We run experiments in a laboratory to measure how noises in the environment affect listeners’ thinking, stress levels, and health. We measure the listeners’ brain activity, how much they sweat, and their heartbeat changes in response to noises like car engines, train squeals, and airplanes taking off. We match up the brain activity we measure with what people tell us about their responses to noisy sounds. This work will help us to make the world sound better for everyone—the more we understand how we hear, and design better places and spaces to improve our experiences with sound.
I am a psychoacoustician. That means I am interested in what happens in our bodies and our brains when we hear different kinds of sounds. There are many different kinds of sounds—speech, music, traffic noise, and animal calls, to name a few. This article looks at environmental sounds, which are the kinds of sounds we hear in everyday life across towns, cities, and rural areas. I will describe an experiment in which we play various environmental sounds (trains, planes, car traffic, building noises, and a few others) to people. We want to understand how people feel when they hear these different types of sounds, and ultimately we hope that our work will assist architects, engineers, and planners with their design choices, to make the world sound as good as possible for everyone. But why?
Sound vs. Noise
In the modern world, noise is a big problem. But what is the difference between “sound” and “noise”? Essentially, the difference comes down to whether the listener wants to hear the sound. Noise consists of sounds that people do not want to hear. When noise starts to take a toll on human health, it becomes a pollutant. If you have spent any time in a big city, you are likely to have suffered from noise pollution at some point. The World Health Organization rated environmental noise as the second biggest health problem facing Western Europe in 2018! Around the same time, the British government estimated that traffic noise—car noise, specifically—cost the economy £8 billion per year, not just from dealing directly with noise complaints but also because noise pollution can distract us from our work or interrupt a good night’s sleep, which ultimately brings our productivity down.
Why is noise so damaging? We know that noise affects our sleep and our concentration at school or at work. Noise can make us feel stressed, and there is increasing evidence to suggest that it affects our heart health, too. This makes noise a very serious problem, and a difficult one to deal with. Noise affects all of us differently. One of the biggest challenges for psychoacousticians is understanding human responses to noise.
Problems With Measuring Noise
Acousticians often use technology to measure sound levels. For example, a sound pressure meter might measure how intense the pressure of a sound wave is, but devices like these do not tell us how sounds affect people. We are interested in people’s emotional responses to sounds because the perception of the sound is what makes it either noisy (annoying and unwanted) or not noisy (wanted). Imagine your friend is enjoying listening to very loud rock music. To your friend, this sound is pleasant and causes good feelings. But if you were in the room next door trying to sleep, you might feel very differently about your friend’s music! You would perceive the music as noise and might find yourself banging on your friend’s door to turn it down!
In our experiments, we often try to understand how sounds are pleasant to one person and annoying to another. But how do we measure how annoying a sound might be?
One way to do this is to rate annoyance on a scale of 1–10, with 1 being a very negative emotion and 10 being very positive. This kind of scale is called a valence. The trouble is that a very intense and positive emotional response might be excitement, whereas a less intense but equally positive emotional response might be relaxation. A very intense negative emotional response could be anger or fear. This illustrates one of the problems with using valence to measure emotional responses—how do we differentiate between two very different emotional responses, like excitement vs. relaxation or anger vs. fear?
There is another problem with this type approach: the person being tested must be paying attention. Imagine we are trying to find out how noise affects sleep. We could play loud noises near someone who is sleeping and ask them to tell us how that noise makes them feel. The trouble is, each time we wake the person up, they will become more and more annoyed and find it more and more difficult to get back to sleep. Or perhaps we are trying to work out how noise affects people when they are driving, but asking drivers lots of questions while they are trying to concentrate on the road could be dangerous!
Measuring Listeners’ Response to Noise
To overcome some of these problems, we design laboratory tests. We record noises from the real world and play them to people using a technique called ambisonics, which is a specialized kind of surround sound. We then measure how listeners’ brains and bodies react using biosensors, which are devices that record things like heart rate, sweat production, muscle tension, and brain activity.
Figure 1 shows a technique called electroencephalography (EEG). EEG records brain activity. It works by measuring the electrical activity inside the brain using tiny electrodes in a cap that is placed on the scalp. By watching how these signals change, we can interpret how the brain is reacting to the various sounds that we play for our listeners. We also monitor how much sweat listeners are producing, as this can tell us more about their emotional states, like their levels of tension or relaxation. Finally, we might look at how a listener’s heart rate changes over time. Heart-rate variability can tell us more about how the listener is feeling. If you have ever watched a spy movie, you will know that these are the same types of sensors used in lie-detector tests!
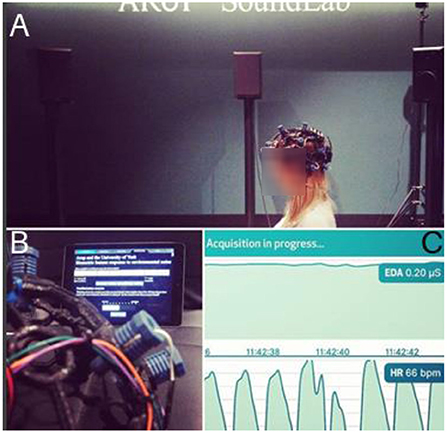
- Figure 1 - (A) A listener undergoing EEG.
- She is wearing a cap with electrodes that measure her brain activity, while she is listening to environmental sounds. (B) A closeup of the EEG electrodes and cables on the cap. (C) A live data stream of electrodermal activity (sweat), and heart rate.
EEG is a well-established technology, and there are lots of ways to interpret EEG data by studying the unique patterns of brain activity, which is displayed in the form of a color plot called a topograph (Figure 2). EEG can not be used to read humans’ minds, but it can help us understand if a person is sad, angry, afraid, or relaxed. EEG topographs give us a much clearer picture of how a person feels than we could get by just asking them, so this technique can help us compare the effects that various sounds have on many individuals.
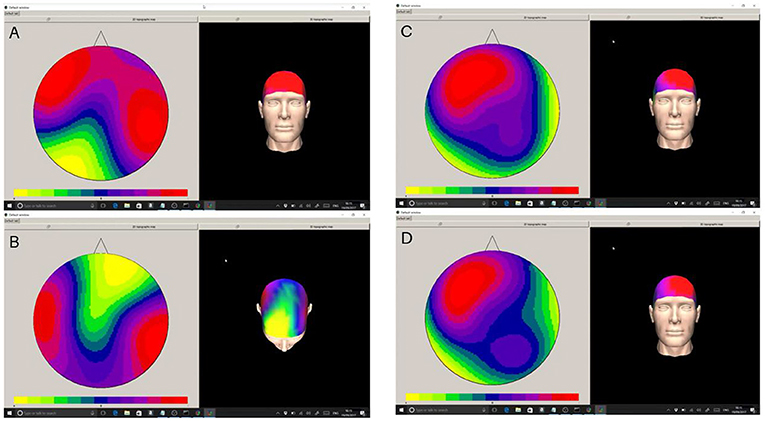
- Figure 2 - Topographs show electrical activity from the brain, measured on the surface of the scalp.
- The colors relate to intensity of brain activity. In the scale, yellow is low activity and red is high activity. The triangle at the top of the circle on the topographs on the left represents the listener’s nose. If we compare [(A), top pair] “angry” topographs with the topographs of [(B), bottom pair] which are “afraid” topographs, we can see that they are almost exactly opposite to one another. Topographs show electrical activity from the brain, measured on the surface of the scalp. The colors relate to intensity of brain activity. In the scale, yellow is low activity and red is high activity. The triangle at the top of the circle on the topographs on the left represents the listener’s nose. If we compare [(C) top pair] “happy,” with the topographs of [(D), bottom pair] which are “sad” topographs, we can see that they are very similar to each other.
Figures 2A,B illustrates that an angry topograph is almost the reverse of an afraid topograph. This makes sense, and we even have a common saying about this type of response: fight or flight. Anger and fear also have unique and well-known effects on our hormonal responses including the release of substances like endorphins. Measuring these hormones and others can further help us to study the effects of noisy sounds on people’s bodies.
Something interesting happens when we play people happy vs. sad sounds—the topographs do not show much of a difference (Figures 2C,D)! At first glance that does not make sense—why would people feel the same, whether they are hearing happy or sad music? Well, we know that people enjoy listening to sad music sometimes—maybe you can think of a few sad songs that you like! This taught us that we should think about these responses as indicating enjoyment. We also have a saying for this type of response: “I did not know whether to laugh or cry!”
What About Environmental Sounds?
When we asked people to rate their own level of annoyance to environmental sounds, we obtained some interesting results (Figure 3). According to our listeners, the construction noise was the most annoying sound. And the least annoying sound? Interestingly, it was the traffic sounds! But most of our listeners lived in a major city, so perhaps they found those sounds quite normal.
![Figure 3 - We used a standard scale [ISO 15666:2003, [1], p. 15,666] to assess listeners’ annoyance in response to several types of environmental sounds.](https://www.frontiersin.org/files/Articles/689100/frym-10-689100-HTML/image_m/figure-3.jpg)
- Figure 3 - We used a standard scale [ISO 15666:2003, [1], p. 15,666] to assess listeners’ annoyance in response to several types of environmental sounds.
- Red indicates that sounds were more annoying. In this case, the sound of the breaker was the most annoying sound, with the sound of urban traffic being least annoying. A construction breaker is a heavy duty percussion hammer tool for breaking up concrete and similar materials. Aircraft appears twice because the aircraft sound was repeated in each test, to use as a control signal.
In the Future…
In this article, we talked about a few different types of sensor that you can use to measure how people respond to different types of sound. These devices are getting smaller and more practical to use for long durations, so that in the future, we are hoping to bring together all of these ideas, to predict what might happen in our bodies and brains when we are exposed to new types of building noise or transportation noise, like new railways, runways, and the like. We hope that our results will help architects and engineers to make informed decisions and, ultimately, create a more pleasant-sounding world.
Glossary
Psychoacoustician: ↑ A scientist who specializes in understanding psychological reactions to sound.
Noise Pollution: ↑ Unwanted noise, generally in the work or home environment.
Perception: ↑ A way of measuring the different types of responses we might experience to a given stimulus.
Valence: ↑ A measure of positivity in emotional response.
Ambisonics: ↑ A technique for creating highly realistic spatial audio scenes using multiple loudspeakers.
Biosensors: ↑ Sensors which monitor biophysiological reactions, such as heart rate, sweat, or brain activity.
Electroencephalography: ↑ A specific biosensor technique which uses sensors that are connected to the scalp to measure electrical activity from the brain.
Topograph: ↑ A graphical representation—in our case, of the surface of the scalp used to show where activity occurs whilst using an electroencephalograph.
Conflict of Interest
The author declares that the research was conducted in the absence of any commercial or financial relationships that could be construed as a potential conflict of interest.
Original Source Article
↑Daly, I., Malik, A., Hwang, F., Roesch, E., Weaver, J., Kirke, A., et al. 2014. Neural correlates of emotional responses to music: an EEG study. Neurosci. Lett. 573:52–7. doi: 10.1016/j.neulet.2014.05.003
References
[1] ↑ Acoustics, I. 2003. Assessment of Noise Annoyance by Means of Social and Socio-Acoustic Surveys. ISO/TS 15666. International Organisation for Standardization.