Abstract
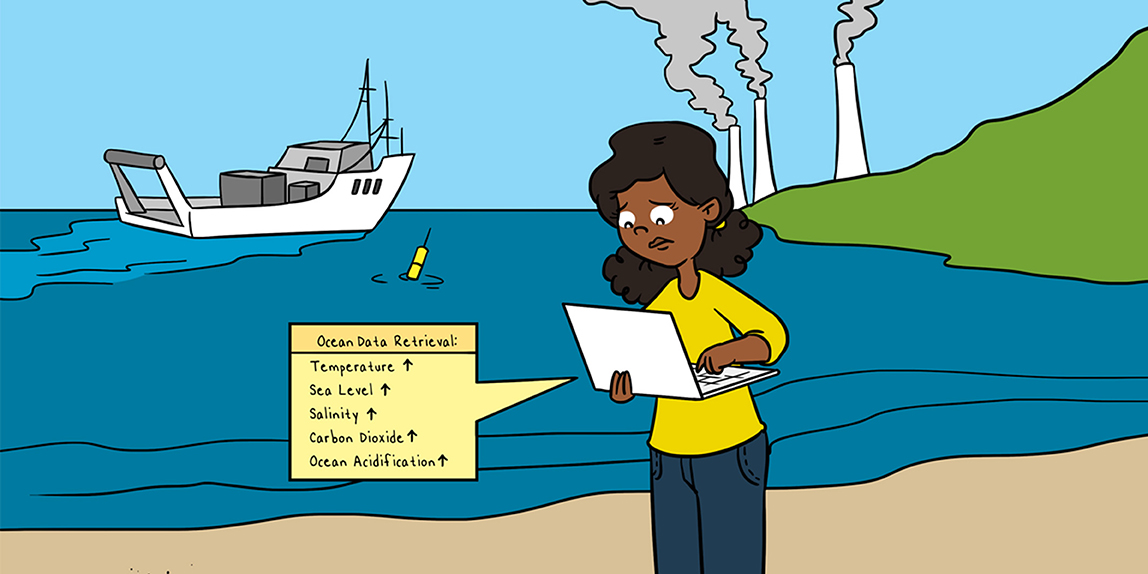
Have you stood on the beach or crossed the ocean on a plane, wondered at the enormous size of the ocean, and possibly thought about how it regulates our climate? Or how our climate is changing? Or what harm our extra carbon dioxide and heat are causing to life in the ocean? The oceans take up heat from the atmosphere and sun, they change their saltiness as they are either evaporated or rained on, and they exchange gases with the atmosphere, including some of the extra carbon dioxide that humans add to the atmosphere. Ocean currents and mixing carry heat and carbon for tens to hundreds of years, and as they move heat and carbon around, the currents alter the atmosphere above. We only have this knowledge because we have been observing the ocean from ships for a century, adding satellites, and drifting instruments in the last few decades.
Our Climate Affects the Oceans
The oceans are huge: they cover 71% of Earth’s surface and are 5 kilometers deep on average. And the oceans are changing. Humans have been increasing the amounts of greenhouse gases, mostly carbon dioxide (CO2), in the atmosphere. This causes the atmosphere to warm and changes rainfall and evaporation. Climate change is causing ocean temperatures to rise, from the surface to the ocean bottom (Figure 1). Ocean salinity (the amount of salt dissolved in ocean water) is shifting over very large regions because of the rainfall/evaporation changes. Part of the atmosphere’s extra CO2 ends up in the ocean. This extra CO2 is called anthropogenic carbon, which means “human carbon,” because it comes from human activity, like from cars that use gasoline or factories that use coal or gas. These sources of energy are called fossil fuel. When CO2 dissolves in seawater, the water becomes more acidic, which is harmful to shells and bones. Oxygen is another very important gas in the oceans and atmosphere. Many ocean organisms need oxygen, and we have seen that the amount of oxygen dissolved in seawater is going down, mostly due to climate warming.
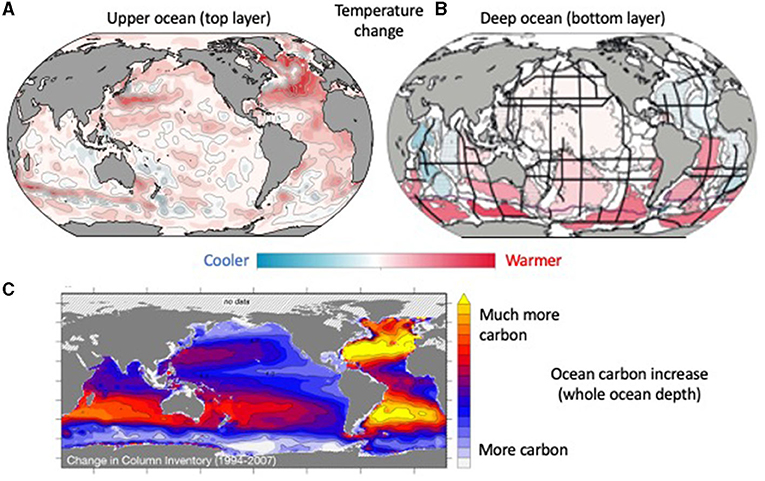
- Figure 1 - (A) The top layer of the ocean has warmed (red colors) based on our temperature measurements over 30 to 40 years.
- The biggest warming is in the Atlantic and the North Pacific. (B) Warming at the ocean bottom looks very different: most warming is in the Southern Hemisphere, around Antarctica. The black lines show where ship measurements were made. (C) The ocean has taken up extra CO2 from the atmosphere since the 1990s. The Atlantic Ocean has the most extra carbon (yellow). Most of the extra CO2 in each ocean is in the middle-latitudes because of ocean circulation. Source: Top left and right: Rhein et al. [1]. Bottom: After Gruber et al. [2].
How do we understand climate and predict its future? First, we observe the oceans, atmosphere, land, and sun. We observe how they are changing because of fossil fuel burning, land use changes, and other human impacts. Then we build, run, and improve huge computer models based on what we observe. These models allow us to test ideas about how the climate operates and predict the future of the climate. The more observations we have, the better the models and the better the predictions/forecasts.
What Climate Changes Have We Observed in the Ocean?
Oceanographers have been measuring the ocean for hundreds of years. We have mostly used ships (“GO-SHIP1”). About 30 to 40 years ago, satellites started observing the surface ocean, and satellite communications began to allow robotic instruments to send information back to the lab, without the need for a ship. Robotic instruments now measure the top half of the world’s oceans every 10 days [3]. But ship measurements are still needed to measure the oceans very accurately from top to bottom, and to measure the ocean chemistry that is important for life, such as the amounts of carbon, oxygen, and nutrients present.
Temperature Changes
Temperature is the most basic ocean property we measure from ships. In most places on Earth, temperatures in the upper part of the ocean has risen over the last 50 years (Figure 1A), because the atmosphere above the ocean is warming. We have also observed temperature changes all the way to the bottom of the ocean. The biggest bottom temperature warming is happening around Antarctica (Figure 1B). This is because, around Antarctica, it only takes a few years for cold, heavy surface water to sink to the ocean bottom, so changes happen fairly quickly in these waters. However, over the last few decades, there has been less and less very cold, heavy water along the coasts of Antarctica. Because there is less cold water, the bottom is warming up.
In these two ways—by the atmosphere warming the upper ocean almost everywhere and warming of the deep ocean mostly around Antarctica—the ocean has taken up more than 90% of the extra heat in Earth’s climate system. What happens when the ocean warms? The water expands. This causes the ocean surface to rise, which is called sea level rise. Sea level is also rising because the warming atmosphere melts land ice, like glaciers and ice sheets, and this water goes into the ocean. These two effects contribute about equally to sea level rise.
Salinity Changes
Salinity is the second important physical quantity that we measure. The ocean is salty, as you know from a surprise mouthful of water at the beach. The total amount of salt in the ocean hardly changes at all, but where it rains a lot, the seawater is diluted by the freshwater and salinity goes down. Where there is a lot of evaporation, the seawater salts become more concentrated and salinity goes up. If seawater is saltier, then it is heavier. Salty water that is close to the freezing point is very heavy, and fills the bottom of the ocean.
Rain and evaporation are changing because the warmer atmosphere can hold more water vapor and move it from dry regions to rainy regions, including over the ocean. With ship and robotic measurements, we see that salty ocean regions are getting saltier and fresher ocean regions are getting fresher. This means that dry regions are getting drier and wet regions are getting wetter. This is also happening on land, but it is much harder to measure rainfall and evaporation changes than to measure ocean salinity. Salinity measurements have become a rain gauge for the planet.
Carbon Dioxide (CO2) Changes
Climate change is mostly driven by increasing CO2 in the atmosphere. CO2 is rising because humans are burning fossil fuels. From our ship measurements, we have seen that about 25 to 30% of this extra CO2 enters the ocean, through air bubbles trapped in surface waves. This sounds like a good service that the ocean provides—it cleans up the atmosphere a bit. But when CO2 dissolves in water, the water becomes slightly acidic. All seawater (and rainwater) is slightly acidic. When extra CO2 from the atmosphere dissolves in seawater, it makes it even more acidic. This is called ocean acidification, and it can devastate some ocean organisms by causing shells and bones to dissolve more easily, which means organisms may end up smaller or deformed or even die.
Ocean Current Changes
Ocean currents that connect large parts of the ocean (Figure 2) are changing slightly because of the changing ocean temperature and salinity, and because winds are changing. From ships measuring from one side of the ocean to the other (Figure 3C), we can say how much water moves from one ocean to another, how much moves down to the deep ocean in cold regions (near Greenland and Antarctica), how long it moves around in the deep ocean, and where it comes back up to the warm surface. These ocean currents are called the overturning circulation and sometimes also called the ocean conveyor belt. The overturning circulation is important for the climate because it carries heat and carbon around. Changes in the overturning circulation can warm and cool whole oceans.
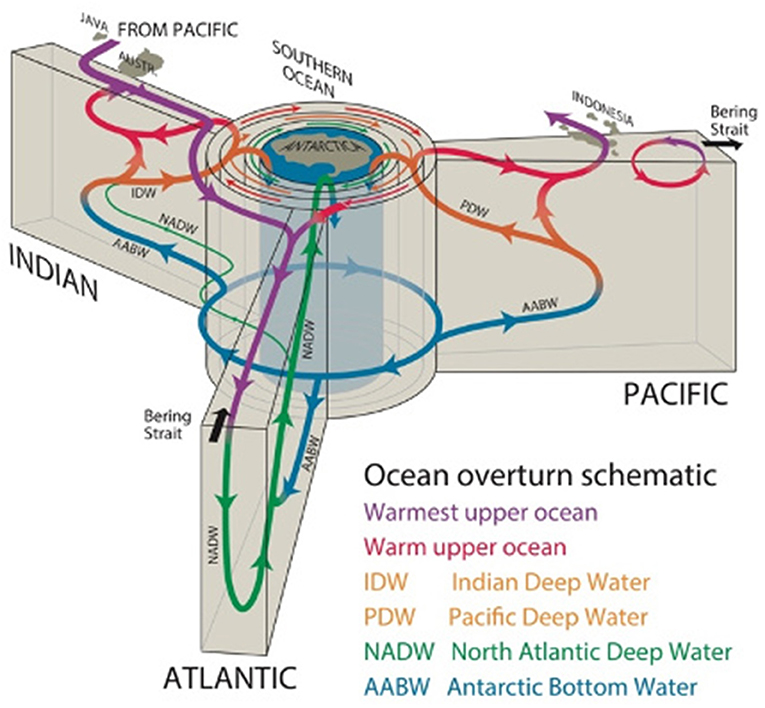
- Figure 2 - The overturning circulation that connects the ocean surface and ocean bottom.
- The Atlantic, Indian, and Pacific Oceans are connected around Antarctica. Surface water sinks in the cold, northern Atlantic and flows southward toward Antarctica. There, it rises to the sea surface, gets very cold, and sinks. This very cold water flows northward to fill the bottom of every ocean. Heat from the ocean surface trickles down and warms the cold waters, which rise toward the surface, some in the tropics, and some driven upward by winds in the south. The warm water flows back to the North Atlantic. Source: Adapted from Talley [4].
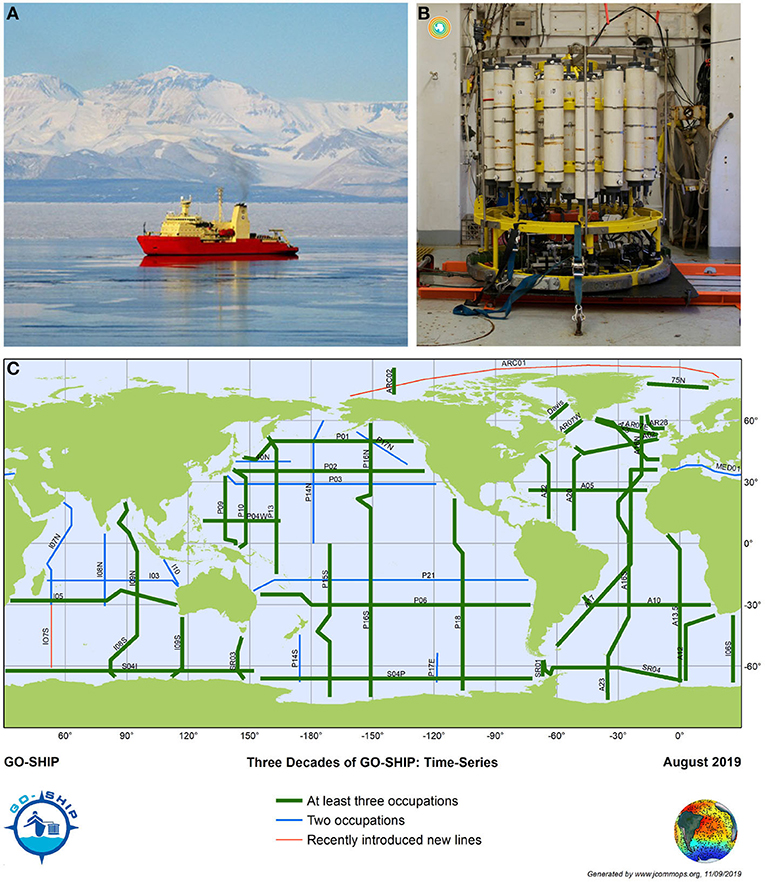
- Figure 3 - (A) An ice breaker research ship off the coast of Antarctica.
- (B) Equipment used on GO-SHIP cruises to measure the ocean temperature, salinity, carbon, and other chemicals. The “package” includes bottles in a circle around the frame (called rosette sampler), and several electronic instruments that lie across the bottom of the frame under the bottles. Some of these instruments measure temperature, salinity, and depth. The bottles in the rosette are ready to go into the ocean: the gray caps of the bottles are open, ready to sample. (C) Map of where research ships have made the carefully repeated measurements each decade since the 1990s. Data from these measurements was used to create the maps in Figure 1. Source: Top left: Holly Gingles (https://www.nsf.gov/geo/opp/support/nathpalm.jsp). Top right: Earle Wilson (https://www.flickr.com/photos/139764369@N07/27864642302/in/album-72157667622005814/). Bottom: Global Ocean Observing System website for global ocean observation efforts, https://www.ocean-ops.org/.
Advances in Ocean Observations From Ships
In the late 1800s, there were huge advances in observing the world’s oceans. Ocean temperature was measured with mercury thermometers, and salinity was measured by evaporating sea water from samples and weighing the remaining dry salt. In the early 1900s, these measurements became much more accurate and easier to make: thermometers were improved and a laboratory method to measure salinity were invented. These methods were used until the 1950s.
Modern oceanography was born in the 1950s and 1960s, when digital sensors for temperature, salinity, and pressure (which is an indicator of depth) were developed. Carbon, oxygen, nutrient, and velocity measurements were also improved. In Figure 3B, you can see a frame with instruments and water sampling bottles attached to a wire. This equipment is lowered from the ship. The ship’s computer lab receives signals from the instruments through the wire. The lab also sends commands to the bottles to collect water.
In the late 1980s, space agencies launched satellites to observe Earth2. Some satellites measure ocean surface temperature and other useful surface properties. Global observations within the ocean were made to match the satellites, as part of the World Ocean Circulation Experiment (WOCE3) of the 1990s. WOCE sampled every ocean basin, from the sea surface to the ocean bottom (Figure 3C). We understand a lot about temperature, salinity, carbon, oxygen, nutrients, and ocean currents because of WOCE.
In the 2000s and 2010s, we found out that the ocean was changing enough that its changes could be measured. We have kept measuring every 10 years along about half of the WOCE lines as part of the GO-SHIP program (Figure 3C), to document changes in the global ocean from top to bottom [5]. Our research ships (Figure 3A) move across the ocean basins at a top speed of about 10 knots (18 km/h, so bicycling speed). To collect data for GO-SHIP, the ships stop about every 60 km to lower their instruments to the ocean bottom and pull them back, which takes about 4 h. Completing “lines” across the ocean takes several months. GO-SHIP shipboard measurements are made by many different countries. National representatives talk often to coordinate. Big decisions about what to improve have been made at meetings called OceanObs every 10 years.
Become an Oceanographer
Ship observations will be our continuing information source for deep temperature, salinity, and full-ocean chemistry changes, and now also for looking at living organisms. And we need to do this every year during the following decades. So, we need you to become an oceanographer. You can become a physical oceanographer and study the global ocean currents, a chemical oceanographer and study salinity changes and nutrients, or a biological oceanographer and study the impacts of ocean acidification on organisms. The ocean waits for you!
Glossary
Climate Change: ↑ Climate is the average weather (warm, cool, rainy, dry). Climate variability is the natural variations in climate. Climate change is the variation that is due to human activity.
Salinity: ↑ The weight of salts dissolved in a kilogram of seawater. Units of salinity are usually written as grams of salt per kilogram of seawater.
Anthropogenic Carbon: ↑ Carbon in the ocean that results from humans’ burning of fossil fuels.
Ocean Acidification: ↑ The increase in how acidic the seawater is, as a result of addition of anthropogenic carbon. Seawater is always slightly acidic because carbon dioxide is always present, dissolved from the atmosphere, but acidification is the increase in this acidity.
Overturning Circulation: ↑ The currents of the world’s ocean that connect the waters at the surface to the inside and bottom of the ocean, and connect the large oceans such as the Pacific, Atlantic, Arctic, Indian, and Antarctic region.
Conflict of Interest
The author declares that the research was conducted in the absence of any commercial or financial relationships that could be construed as a potential conflict of interest.
References
[1] ↑ Rhein, M., Rintoul, S. R., Aoki, S., Campos, E., Chambers, D., Feely, R. A., et al. 2013. “Observations: ocean,” in Climate Change 2013: The Physical Science Basis. Contribution of Working Group I to the Fifth Assessment Report of the Intergovernmental Panel on Climate Change, eds T. F. Stocker, D. Qin, G.-K. Plattner, M. Tignor, S. K. Allen, J. Boschung (Cambridge; New York, NY: Cambridge University Press).
[2] ↑ Gruber, N., Clement, D., Carter, B. R., Feely, R. A., van Heuven, S., Hoppema, M., et al. 2019. The oceanic sink for anthropogenic CO2 from 1994 to 2007. Science 363:1192–9. doi: 10.1126/science.aau5153
[3] ↑ Roemmich, D., Alford, M., Claustre, H., Johnson, K., King, B., Moum, J., et al. 2019. On the future of Argo: a global, full-depth, multi-disciplinary array. Front. Mar. Sci. 6:439. doi: 10.3389/fmars.2019.00439
[4] ↑ Talley LD. 2013. Closure of the global overturning circulation through the Indian, Pacific and Southern Oceans: schematics and transports. Oceanography 26:80–97. doi: 10.5670/oceanog.2013.07
[5] ↑ Sloyan, B. M., Wanninkhof, R., Kramp, M., Johnson, G. C., Talley, L. D., Tanhua, T., et al. 2019. The Global Ocean Ship-Based Hydrographic Investigations Program (GO-SHIP): a platform for integrated multidisciplinary ocean science. Front. Mar. Sci. 6:445. doi: 10.3389/fmars.2019.00445