Abstract
The COVID-19 pandemic has led to significant changes in how people are currently living their lives. To determine how to best reduce the effects of the pandemic and start reopening communities, governments have used mathematical models of the spread of infectious diseases. In this article, we introduce a popular type of mathematical model of disease spread. We discuss how the results of analyzing mathematical models can influence government policies and human behavior, such as encouraging mask wearing and physical distancing to help slow the spread of a disease.
Modeling Infectious Diseases
At the end of 2019, doctors and scientists learned about a new virus, now called “severe acute respiratory syndrome coronavirus 2” (SARS-CoV-2), that was spreading in China. The virus causes a disease called “coronavirus disease 2019” (i.e., COVID-19) [1, 2] that has spread throughout the world as a global pandemic1. What makes this virus so dangerous is that it spreads so easily from person to person and that people who become infected with COVID-19 can get very sick and die.
Scientists help people recover from viruses by designing medicines and medical equipment. Using mathematics and computation, scientists also investigate ways to keep people safe by studying the effects of actions like physical distancing and wearing masks. Governments can then use the knowledge that is gained from such research to develop health guidelines and policies. In this article, we discuss the mathematical modeling of infectious diseases [5, 6]. Scientists who specialize in these studies are often called mathematical epidemiologists.
To improve our understanding of how a disease spreads, scientists use a combination of mathematics and data for mathematical modeling. Mathematical models provide a way to formulate simple rules to approximate how a virus like SARS-CoV-2 spreads (and thereby approximate the spread of the associated disease COVID-19). When creating and studying a mathematical model, scientists seek to improve the accuracy of forecasts of how a disease will spread. They also try to test the effects of possible responses, such as everyone staying at home, to reduce the number of infections that result from the spread of a disease. Their research can help inform the people who make guidelines or policies to protect others from diseases [5].
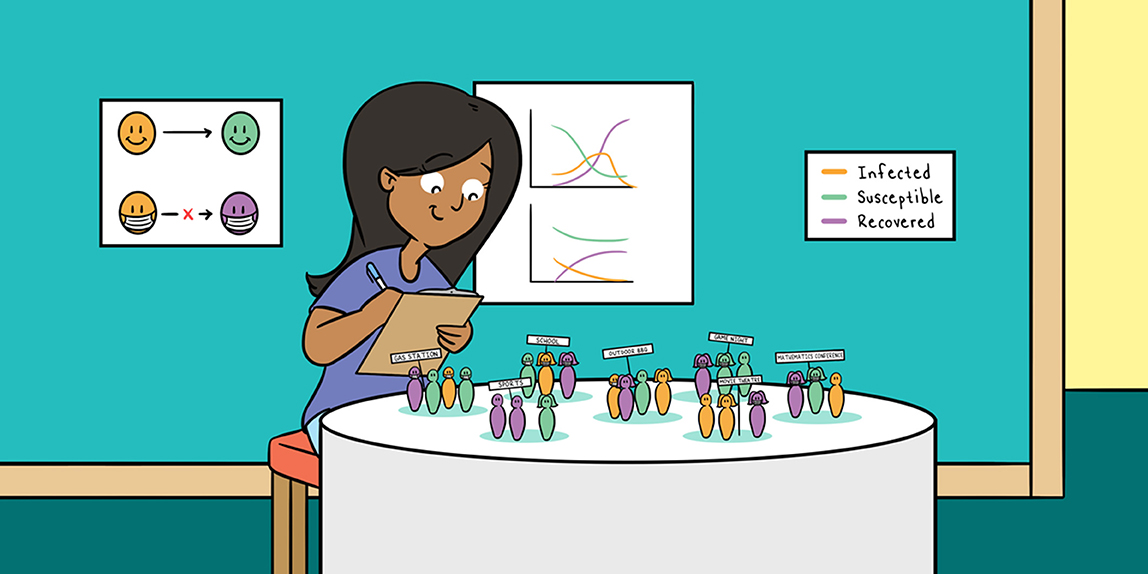
One way to mathematically model how a disease spreads is to use a compartmental model, such as an SIR model (see Figure 1). In a compartmental model, scientists separate a population into categories called “compartments” and examine how people change categories over time. SIR models get their name from their compartments, which are “susceptible,” “infected,” and “recovered.” The “S” compartment consists of people who are susceptible to infection, which means that they can get the disease that is spreading. The “I” compartment consists of people who are infected and who can thus infect others. The “R” compartment consists of people who have recovered from the infection, although “R” can also stand for “removed” to account for people who die from the infection.
- Figure 1 - One way to mathematically model the spread of an infectious disease is to use a compartmental model.
- In a type of mathematical model called an SIR model, one divides a population into susceptible (S), infected (I), and recovered (R) compartments.
When developing a mathematical model of the spread of a disease, it is desirable to focus on the most important factors for the spread of that disease and on the particular scientific questions of interest, so that the model is as simple and informative as possible. These factors are different for different diseases. Relevant factors include the frequency and duration of in-person contacts, such as shaking hands, seeing a movie together, or playing board games [6]. Such contacts give a disease the opportunity to spread. Some types of disease require very close contact to spread, but others can spread even by simply touching the same surface as an infected person or just by being nearby.
How Quickly Does a Disease Spread?
Let’s illustrate the modeling of the spread of an infectious disease with an SIR model [5]. Before we can use an SIR model to study the spread of a disease in a population, we must know (or estimate) a few important factors:
- The amount of time that a person is infectious. This tells us how long infected people can infect other people.
- The rate of in-person contact in a population. This indicates how often people are close enough to each other for a disease to spread from person to person.
- The chance that an in-person contact leads to an infection.
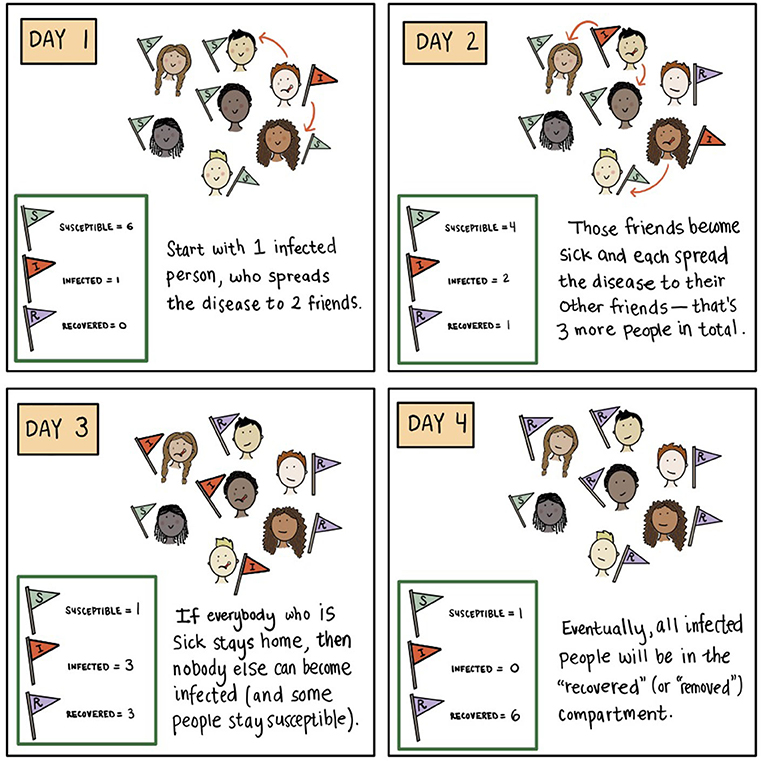
These three factors allow scientists to estimate a quantity called the basic reproduction number, which is denoted by R0 (pronounced “R naught”). The value of R0 indicates the average number of people to whom a single infected person spreads a disease in a population of susceptible people. Suppose that a disease is spreading in the city of Los Angeles. Before the disease begins to spread, everyone in Los Angeles is in the “susceptible” compartment. Now suppose that someone who has the disease flies into Los Angeles and starts to spread it to other people in the city. If R0 is 2 and the time that a person is infectious is 1 day (and then they recover), that person will spread the disease to two other people, on average, before recovering. Those two people, in turn, will spread the disease to an average of two more people each before recovering, and so on. In this simplified setting, we can estimate how many people will become infected by a certain time.
When R0 is larger than 1 (which we write mathematically as “R0 > 1”), the number of infected people grows exponentially. To see how exponential growth works, we use our above example with R0 = 2 and an infectious period of 1 day. Suppose that the initially infected person infects two people on the day that they fly into Los Angeles and that each of these two people infects two other people on the next day. (Remember that infected people recover in 1 day in this example.) On the day after that, those four infected people can each infect two more susceptible people. In 3 days, we expect to have about 2 × 2 × 2 = 8 infected people. If this pattern continues and there are still many susceptible people, we multiply by 2 again, so we expect to have about 16 newly infected people on the next day. Remember that these infections come from just one initially infected person! If we instead start with 100 infected people, we can see how the situation can become very bad very quickly.
The number of people who become infected by a disease continues to increase until the rate at which infected people recover exceeds the rate at which they infect susceptible people. If each infected person infects fewer than one other person per day on average, then we expect that there will be fewer infections each day and that the disease will die out eventually. How long this takes, and whether it occurs, depends on the size of a population and the in-person contacts of the people in it2.
In Figure 2, we compare what happens to the numbers of susceptible, infected, and recovered people in a population when R0 > 1 versus R0 < 1. In Figure 2A (for which R0 > 1), the number of people who are infected at the same time can be very large (see the orange curve), and hospitals may not have the capacity to treat everybody who becomes infected. When R0 < 1 (see Figure 2B), the disease does not spread to many people in the population, so the curve of infected people over time is much flatter. This scenario is desirable, and if a disease is spreading quickly, we want to slow infections and “flatten the curve”3 (see Figure 3).
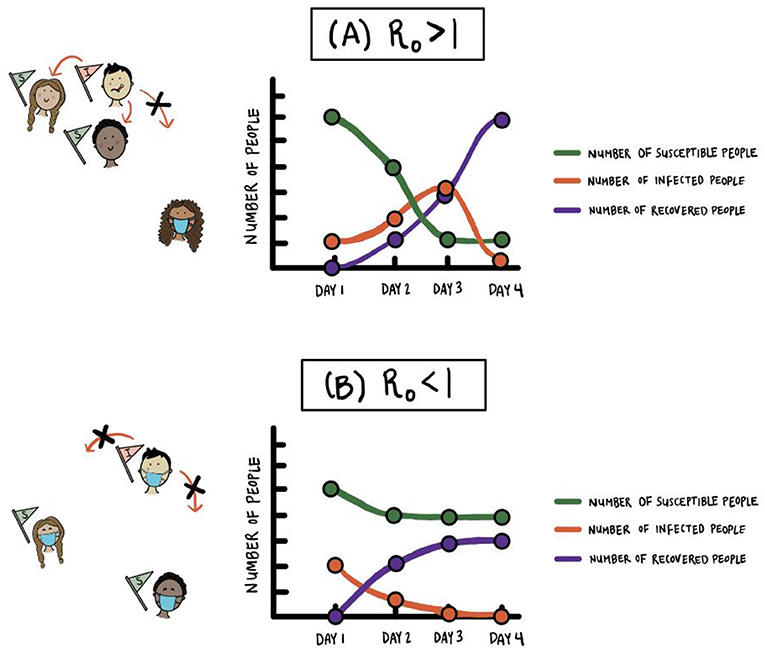
- Figure 2 - Comparison of the numbers of susceptible, infected, and recovered people in an SIR model of an infectious disease.
- The values on the vertical axis indicate all of the people in the susceptible, infected, and recovered compartments on each day (not just the infections and recoveries that are new that day). (A) When R0 > 1, the number of people who are infected at the same time can be very large and hospitals may not have the capacity to treat everybody. Because almost everybody eventually becomes infected in this situation, the number of susceptible people eventually becomes very small. (B) When R0 < 1, such as when many people are wearing masks and practicing physical distancing, the disease does not spread to many people in a population.
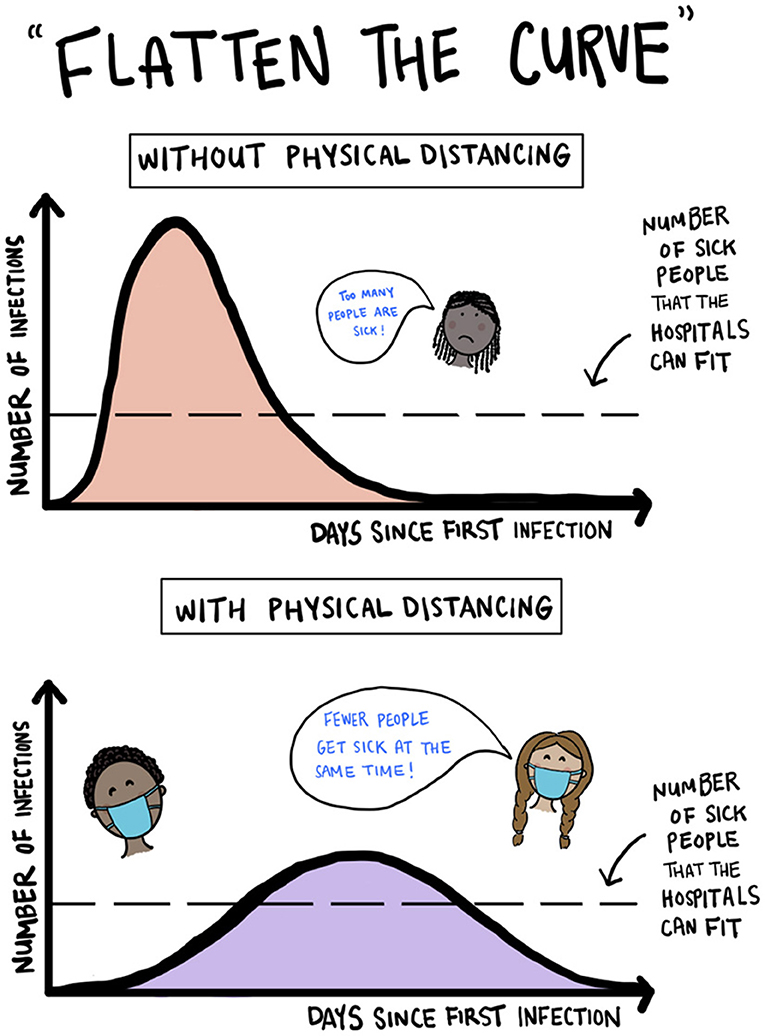
- Figure 3 - Illustration of “flattening the curve” of infection by using physical distancing.
- (Our figure is inspired by pictures like the one at https://commons.wikimedia.org/wiki/File:Covid-19-curves-graphic-social-v3.gif by Siouxsie Wiles and Toby Morris.)
Policy, Behavior, and “Flattening the Curve”
In thinking about how a disease spreads, networks of in-person contacts are important for estimating the value of R0 [4, 6]. You and your friends are connected to each other in a social network, and so are your parents and their friends. Therefore, if one of your friends gets a disease, it may spread to you and then to your parents and then to their friends. Infected people who see many of their friends in person may spread a disease to many people.
Because of how easily people can become infected with SARS-CoV-2 and perhaps become very sick from COVID-19, many governments responded to the COVID-19 pandemic by closing schools, canceling sporting events and other large gatherings, quarantining infected people, and telling people to stay at home and practice physical distancing. The goal of these kinds of policies and behaviors during a pandemic is to try to limit both direct and indirect in-person contacts and thereby “flatten the curve” of the number of infected people (see Figure 3) [4, 6, 3]. With measures like these, along with wearing masks and washing hands often, the number of infected people spreads out more over time and has a lower peak, indicating that the maximum number of infected people on any one day is smaller than it would otherwise be. This is important so that hospitals have the capacity to treat as many people as possible. With a flattened curve, although a disease continues to spread, it spreads more slowly, so there is more space in hospitals to treat infected people who need help. This reduces the number of deaths from a disease. Flattening the curve also decreases the total number of people who become infected over time.
Conclusions
Mathematical models and computation have played a major role in influencing the responses of governments to the COVID-19 pandemic. These models are much more detailed than the SIR model that we discussed above4. For example, many models include a compartment for people without symptoms who can still infect others and some models include a compartment for hospitalized people.
The current COVID-19 pandemic illustrates the importance of the mathematical modeling of infectious diseases. Mathematical and computational approaches allow people to make progress toward reducing the spread of a disease while researchers develop vaccines and treatments. They also help efforts to design interventions and vaccination programs.
Glossary
Pandemic: ↑ The widespread occurrence of an infectious disease across several continents or even worldwide.
Mathematical Modeling: ↑ A mathematical model is a simplified description of something using mathematical rules and language. The development, testing, and refinement of such a model is known as mathematical modeling. An example of a mathematical model is an SIR model of the spread of an infectious disease.
Mathematical Epidemiologist: ↑ A scientist who studies infectious diseases using mathematical modeling and computation.
Forecast: ↑ A type of prediction that gives a range of possibilities of future outcomes. For example, a weather forecaster may say on the news that there is 42% chance of rain in Los Angeles tomorrow. A scientist may forecast a range for the number of people in Los Angeles who get COVID-19 during April 2021.
Contact: ↑ An interaction of any kind between two individuals. An in-person contact can be either direct (such as shaking hands) or indirect (such as touching the same surface or just being nearby).
Compartmental Model: ↑ The most common type of mathematical model that researchers use to forecast how a disease spreads. A compartmental model of the spread of an infectious disease consists of different categories (such as “infected” and “recovered”) called “compartments” and mathematical rules for how people change from one compartment to another. For example, using a susceptible–infected– recovered (SIR) model, we can study how the numbers of susceptible, infected, and recovered people in a population change over time.
Basic Reproduction Number (R0): ↑ The number of infections, on average, that are generated by a single infected person in a population of susceptible people.
Exponential Growth: ↑ A particularly fast type of growth. When a disease grows exponentially, the number of infected people grows in proportion to the current number of infected people. For example, if there is one infected person on the first day that a disease infects somebody in a population and the number of infected people triples every two days, then there will be three infected people on the third day, nine infected people on the fifth day, 27 infected people on the seventh day, 81 infected people on the ninth day, and so on.
Conflict of Interest
The authors declare that the research was conducted in the absence of any commercial or financial relationships that could be construed as a potential conflict of interest.
Acknowledgments
We were grateful to our young readers—Emily Chen, Nia Chiou, Taryn Chiou, Dimitri Chrysafis, Maria Chrysafis, Valerie K. Eng, Iris Leung, Talan Li, Adam Lindemood, Suzanna Lindemood, and Eli Truong—for their many helpful comments. We also thank their parents, teachers, and friends—Alena Carter, Lyndie Chiou, and Christina Chow—for putting us in touch with them and soliciting their feedback. We thank John Butler, Francesca Henderson, Rachel Levy, Joel Miller, our editors, and our reviewers for helpful comments. MAP acknowledges support from the National Science Foundation (grant number DMS-2027438) through the RAPID program, and MAP and YHK acknowledge support from the National Science Foundation (grant number 1922952) through the Algorithms for Threat Detection (ATD) program.
Footnotes
1. ↑ See Zaman [3] to learn more about pandemics and Alberca et al. [1] and Salathé and Case [4] for an accessible introduction to the COVID-19 pandemic.
2. ↑ Try the interactive SIR model in Edenharter [7]. You can also take a look at the discussions in Weinersmith et al. [6] and Zaman [3] and at the discussions and interactive simulations in Salathé and Case [4]
3. ↑ Now that we have discussed R0 some more, take another look at what happens when you change quantities like infection rates and recovery rates in the interactive simulation in Edenharter [7].
4. ↑ See Ferguson et al. [8] for details about a model that was used in the United Kingdom.
References
[1] ↑ Alberca, G. G. F., Fernandes, I. G., Sato, M. N., and Alberca, R. W. 2020. What is COVID-19? Front Young Minds 8:74. doi: 10.3389/frym.2020.00074
[2] ↑ World Health Organization. 2020. Coronavirus Disease (COVID-19) Pandemic. Available online at: https://www.who.int/emergencies/diseases/novel-coronavirus-2019.
[3] ↑ Zaman, L. 2020. Developing an Intuition for Pandemics. Available online at: https://infectiousmatter.com
[4] ↑ Salathé, M., and Case, N. 2020. What Happens Next? COVID-19 Futures, Explained With Playable Simulations. Available online at: https://ncase.me/covid-19/?v=3
[5] ↑ Brauer, F., Castillo-Chavez, C., and Feng, Z. 2019. Mathematical Models in Epidemiology. Heidelberg, Germany: Springer-Verlag.
[6] ↑ Weinersmith, Z., Koerth, M., Bronner, L., and Mithani, J. 2020. A Comic Strip Tour of the Wild World of Pandemic Modeling. Available online at: https://fivethirtyeight.com/features/a-comic-strip-tour-of-the-wild-world-of-pandemic-modeling/
[7] ↑ Edenharter, G. 2015. The Classic SIR Model. Available online at: https://maple.cloud/app/4837052487041024
[8] ↑ Ferguson, N. M., Laydon, D., Nedjati-Gilani, G., Imai, N., Ainslie, K., Baguelin, M., et al. 2020. Report 9: Impact of Non-pharmaceutical Interventions (NPIs) to Reduce COVID-19 Mortality and Healthcare Demand. Available online at: https://www.imperial.ac.uk/mrc-global-infectious-disease-analysis/covid-19/report-9-impact-of-npis-on-covid-19/