Abstract
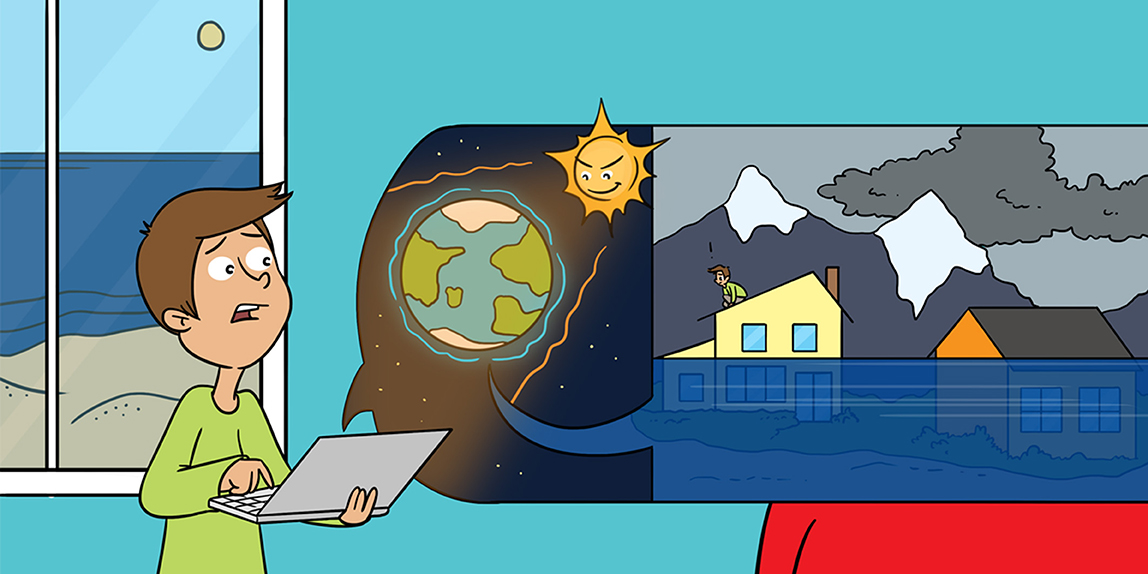
Weather is something that we all experience and when weather is averaged over a long time, it is called climate. The climate is changing and it is because of us. Climate change is already being experienced around the world and will affect everyone. Some scientists and politicians are now calling this a time of climate crisis [1]. For example, communities living close to coastlines may have to move due to sea-level rise. We will have to work together in our communities to understand the problem and to try to minimize its effects on the natural world. As the climate changes, it is not just the air that changes, but other parts of the world, too. In this article we will explore how and why we use computers to build model worlds. We call these climate models. You can help us experiment with climate models and I will tell you how.
What Is Climate Change and Why Is It Important?
We all experience the weather. It changes with the seasons but there are other changes happening over longer periods. This change to the average weather (and to other things too) is called climate change.
The air is made of different gases. One of them is carbon dioxide, or CO2. CO2 is found naturally in the air but is also put there by things that humans do every day. For example, CO2 is put into the air by the engines of buses. It can also be put there by power stations that produce electricity by burning things like coal. When CO2 goes into the air, it makes the air warm up. This is called global warming.
Have you been in a greenhouse? Greenhouses are glass buildings that are used to grow plants. When the sun shines on a greenhouse, the sunlight makes it warmer inside than it is on the outside. Putting CO2 into the air has a similar effect to putting the world in a greenhouse. For this reason, we call gases like CO2 greenhouse gases (GHGs).
In the future, no one knows exactly how much GHG will be in the air. Because of this, we use computers to build model worlds and then estimate what we think might happen to them. The average weather in an area is called the climate, so these model worlds are called climate models. Some of the features included in our model worlds are shown in Figure 1.
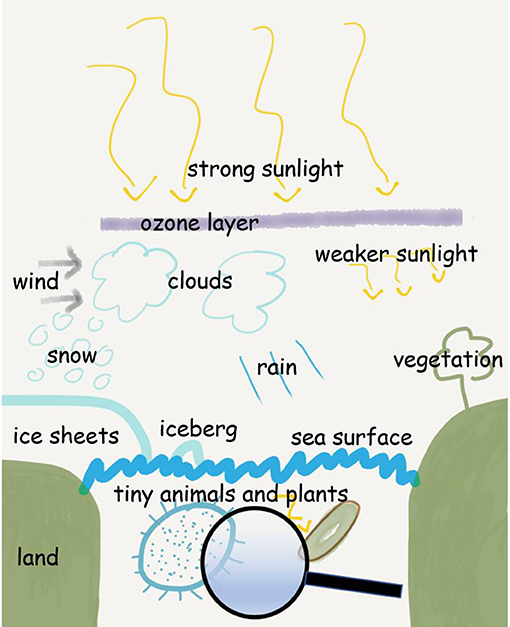
- Figure 1 - Many processes can be included in a climate model.
- At the top, you can see the yellow arrows that represent sunbeams. The dark blue line just below represents the ozone layer. Just below the ozone layer you can see the same sunbeams, which are now less strong because the ozone gas absorbs some of their energy. Just below the ozone layer there are clouds (with snow and rain coming out of them). The two arrows on the left-hand side represent the wind. At the bottom, the big green sections represent the land. The tree on the right shows that vegetation growth can be included in these models, too. Above the land and sea on the left is a big sheet of ice and an iceberg too! Under the blue squiggly line (which shows the sea surface) there are some plankton. Plankton are microscopic animals and plants. The green plankton on the right is a plant and needs light (the sunbeam) to survive, just like plants on the land.
To estimate what might happen in the future, we set up our climate models using what we know about the world today. We let the different elements shown in Figure 1 interact with each other. We then make sure that the model world produces a climate that is as similar to the real world as possible. Once we have done this for the present day, we use our computers to predict what will happen to our climate in the future.
As you can see from Figure 1, we can use our model worlds to look at much more than just the air. For example, if there is more rain in the future, will the type of crops that people grow change? Because the whole natural world is connected, there are loads of other things to think about, for example:
- The different gases in the atmosphere and how they interact with each other through chemical reactions.
- The effect of climate change on tiny plants and animals, called plankton, in the sea. Plankton are affected by sea temperature and the air touching the sea surface. Plankton affect the whole food chain in the sea.
- As the air warms, crops and other plants on the land may need to be grown in different places.
There are many different climate models. Some include all the processes shown in Figure 1 and others just a few! Some organizations have extremely powerful computers so that they can do their calculations very fast. They are called supercomputers and they can do huge numbers of calculations every second. Using the answers that the supercomputers give, we can get a weather forecast for tomorrow, or an estimate of how our climate may change in the future. Just remember that all computers are doing calculations like you can do yourself with a pen and paper, just much faster!
Isn’t Climate Change Just a Natural Process?
This is a commonly asked question, and a good one! The climate has indeed changed before, but currently it is changing faster than normal. The faster rate of climate change is due to human influences on the world, instead of natural processes, which generally happen much more slowly [2].
One way that we can get an idea of the speed of climate change is by looking at ice cores. These are long cylinders of ice that are drilled out of ice sheets from places like Antarctica. Ice cores are made of thousands of years of snow that has fallen but not melted. Tiny bubbles of air can get trapped inside this snow, which is then squashed over the years to form hard ice. These air bubbles contain GHGs and scientists can measure how much GHG was present throughout the thousands of years of squashed snow. Figure 2 shows about 800,000 years of information about CO2 levels from ice cores.
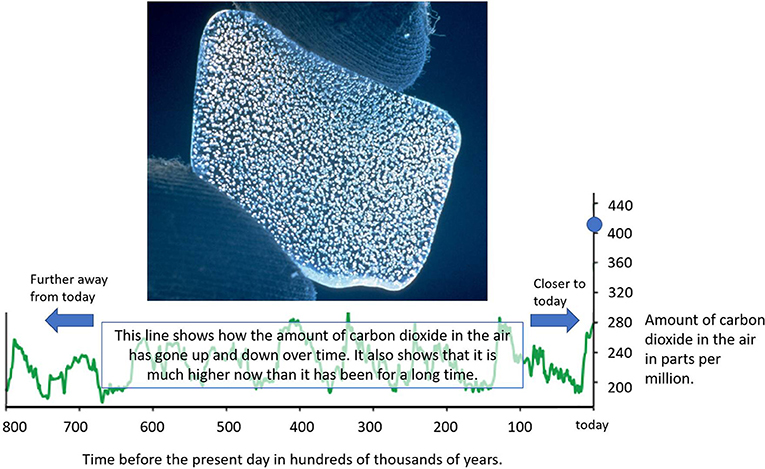
- Figure 2 - The graph on the bottom shows how the amount of carbon dioxide in the air has changed over the last 800,000 years.
- The data is from ice cores [2]. The blue circle on the Y axis shows the amount of carbon dioxide in the air today (early 2020) which is much higher than it has been in the last 800,000 years. The photograph at the top shows a piece of ice from Antarctica with lots of air bubbles trapped inside. This air can be analyzed in a lab to find out how much GHG was in the air when the snow fell and froze solid to form the ice [3].
Until about 200 years ago, people had little effect on the amount of GHGs in the air. The line in Figure 2 shows that, over long periods of time, the amount of CO2 in the air has gone up and down naturally. At the time of this writing though, the amount of CO2 in the air has increased so that it is now a lot higher than it has been in almost the last million years. This is shown by the blue circle in Figure 2. The CO2 level is still increasing. You do not need to understand exactly what the numbers mean, but as you can see from Figure 2, CO2 levels have gone up and down in the past. The key difference though is that the amount of GHG in the air is increasing much faster than before.
What Is a Model and What Is a Simulation?
We have explained what a climate model is, but it is also important to talk about simulations. You now know that a climate model is a model world built on a computer. However, exactly what you do with that model is up to you. You can change the predicted future climate by changing how you use the model.
A simulation is what is produced by the model. What this means is that you can do as many simulations as you want using the same model. I like to think of this as similar to computer gaming. You might be playing a car racing game where you are trying to beat your previous fastest time. The track you are racing on is a computer model of a real racetrack and each time you race on it you are doing a new simulation. Each simulation will be a bit different (a different time in the game) but you are still using the same model (the game).
An Example of Why Computer Models Are Important
Some of you might have heard of the “ozone hole” around the South Pole. Ozone is one of the many different natural gases in the air. Ozone absorbs some of the sun’s rays, which are bad for your skin. Because of the way that things like refrigerators used to be made, certain gases were released into the air that destroyed ozone. These gases are called ozone depleting substances (ODSs). An image showing the ozone hole in 2015 is shown in Figure 3.
![Figure 3 - An example of the ozone hole in 2015 [4].](https://www.frontiersin.org/files/Articles/461075/frym-07-00161-HTML/image_m/figure-3.jpg)
- Figure 3 - An example of the ozone hole in 2015 [4].
- The blue area around the South Pole (where the curved lines meet) shows where ozone was destroyed high up in the atmosphere. More recently, the ozone hole has started to close up again but will take decades to return to its natural state.
This destruction of ozone was discovered in the 1980s, and in 1987 ODSs were banned. The agreement that was reached took place at a meeting in Montreal, so the agreement is called the Montreal Protocol. Since then, the hole in the ozone layer has started to shrink.
Using model worlds, scientists have estimated what the world might have looked like in the future without the Montreal Protocol [5]. Scientists found that banning ODSs has helped to slow down climate change around the North and South poles. This shows that if we work together to fight climate change, we can make a really big difference to the future of our world:
“The Montreal Protocol has not only averted further damage to the ozone layer but has helped prevent significant regional climate change.” [5]
In this case, the model world showed how our climate would have been different in specific regions if ODSs had not been banned. This is an example of why building model worlds and running simulations on those worlds is an important step toward protecting our climate.
You Can Help!
By using the power of the Internet, we can build a special type of computer together. Many people’s computers are often switched on but not doing very much. What this means is that the spare computer power can be used to do some calculations about future climate change.
If you have a computer that you can use, then you can be a climate scientist too. If you want to get involved, then you can go to www.climateprediction.net. Here, you can sign up to run a model of the atmosphere on your own computer!
www.climateprediction.net is just one example of what is called a citizen science project. Citizen scientists are people who give some of their time to help answer a science question. What is great about these projects is that a lot can be achieved using teamwork! There are lots of these projects out there and you can start getting involved today.
Glossary
Greenhouse Gases: ↑ Greenhouse gases (GHGs) are ones which act to warm the air, causing global warming. The most well-known one is carbon dioxide.
Climate: ↑ The long-term average weather conditions of a certain area.
Climate Model: ↑ A climate model is a model world built on a computer. Some climate models are more complicated than others.
Supercomputer: ↑ A supercomputer is one which can perform calculations much faster than a personal computer.
Ozone: ↑ Ozone is a gas in the air which protects against harmful rays from the sun.
Ozone Depleting Substances: ↑ Ozone depleting substances (ODSs) are substances in the air which cause ozone gas to be removed.
Montreal Protocol: ↑ The Montreal Protocol is an international agreement signed by lots of different countries to limit the emissions of ozone depleting substances.
Citizen Science: ↑ Citizen science projects are ones where the public give some of their time to help answer a science question. These are often performed online.
Conflict of Interest
The author declares that the research was conducted in the absence of any commercial or financial relationships that could be construed as a potential conflict of interest.
References
[1] ↑ Archer, D., and Rahmstorf, S. 2010. The Climate Crisis: An Introductory Guide to Climate Change. Cambridge: Cambridge University Press.
[2] ↑ IPCC. 2013. Climate Change 2013: The Physical Science Basis. Contribution of Working Group I to the Fifth Assessment Report of the Intergovernmental Panel on Climate Change. Cambridge; New York, NY: Cambridge University Press.
[3] ↑ CSIRO. 2014. File:CSIRO ScienceImage 521 Bubbles in Ice.jpg—Wikimedia Commons, The Free Media Repository. Available online at: https://commons.wikimedia.org/w/index.php?title=File:CSIRO_ScienceImage_521_Bubbles_in_Ice.jpg&oldid=134917868 (accessed September 9, 2019).
[4] ↑ NASA. 2017. File:Ozone Hole 2015 (22340684609).jpg—Wikimedia Commons, The Free Media Repository. Available online at: https://commons.wikimedia.org/w/index.php?title=File:Ozone_Hole_2015_(22340684609).jpg&oldid=271354780 (accessed September 9, 2019).
[5] ↑ Morgenstern, O., Braesicke, P., Hurwitz, M. M., O’Connor, F. M., Bushell, A. C., Johnson, C. E., et al. 2008. The world avoided by the Montreal protocol. Geophys. Res. Lett. 35:16811. doi: 10.1029/2008GL034590