Abstract
The Earth’s warming climate is reducing snow and ice. The warming of the polar seas causes the sea surface to freeze less in winter and glaciers to retreat, generating more open, ice-free water. Less sea ice provides a longer growing season for marine plants called microalgae (phytoplankton) and removes more carbon, in the form of carbon dioxide, from the atmosphere. The growth of microalgae provides more food for animals that eat the algae and store this carbon through growth of their bodies. The carbon stored by marine life is called blue carbon. When marine animals die some of the blue carbon is buried in the seabed, and that carbon is removed from the carbon cycle. This trapping of carbon in the seabed or in other places is called sequestration. The amount of polar blue carbon increases with climate warming. This is known as negative feedback on climate change. Any negative feedback on climate change is important to help combat global warming. In this article explains what we have learned from measuring blue carbon.
The Carbon Cycle and Blue Carbon
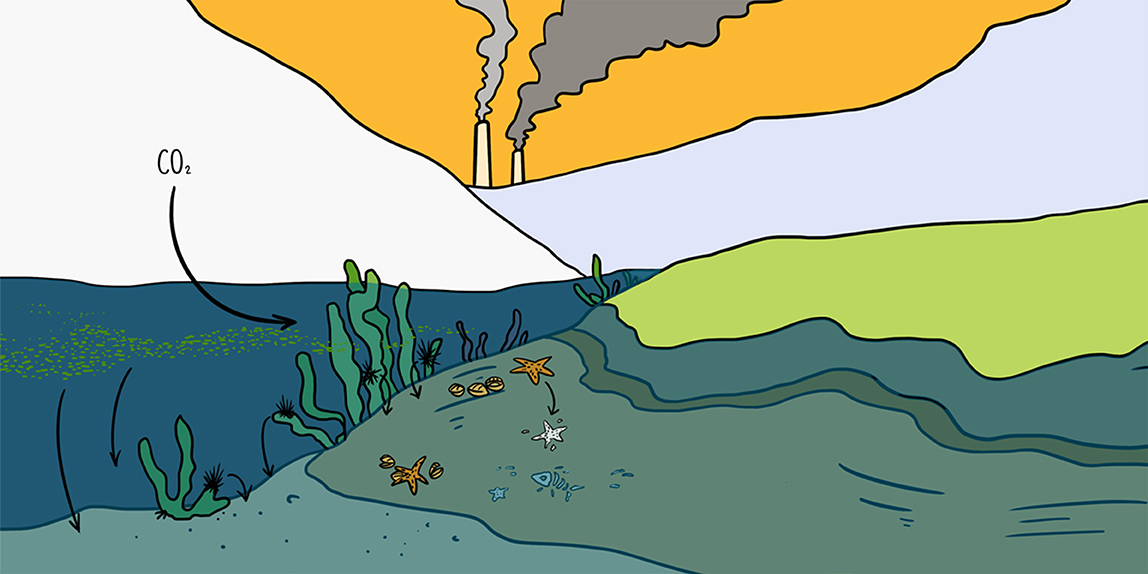
The element carbon is critical for all life forms. Carbon cycles between the atmosphere and earth’s surface. There is carbon dissolved in the sea, stored by organisms in their bodies, buried in soil, and stored in rocks, and in the carbon cycle, carbon moves between these sources. In the atmosphere, carbon is present as the gas carbon dioxide (CO2). On land, CO2 can be used by plants in a process called photosynthesis. In photosynthesis, plants use sunlight to turn CO2 into food, which they use to build new plant tissue. Some of the carbon in plants is returned to the atmosphere as CO2 through plant respiration. Plants can be eaten by animals, which breathe CO2 back into the atmosphere and use some of the remaining plant carbon to build their own bodies. When plants and animals die, the carbon in their bodies is returned to the atmosphere as CO2 as bacteria break down the dead organisms. Long-lived trees or the plants and animals that are buried in wetlands can sequester carbon, which means removing it from the carbon cycle, for over a century. Over long time periods, pressure can convert this buried carbon into oil, coal, or rocks, such as limestone. Volcanic activity or the burning of fossil fuels by humans can return this sequestered carbon to the atmosphere as CO2. CO2 from the atmosphere can then dissolve into the sea, and there the cycle can start again.
Blue carbon is the part of the carbon cycle that involves sea-life. This part of the cycle happens in three stages. Marine plants, such as seaweed and microalgae called phytoplankton take up atmospheric CO2 when they perform photosynthesis. This is known as blue carbon capture. Polar animals eat these phytoplankton and seaweeds and use the carbon in these plants to build their tissues and skeletons. This is known as blue carbon storage. Organisms with a high proportion of skeleton, such as corals, have more chance of protecting that carbon from bacterial breakdown when they die. These organisms are said to immobilize carbon. When blue carbon is removed from the carbon cycle for more than 100 years, for example when marine life dies and is buried on the seabed, this final stage is called blue carbon sequestration.
Carbon Sinks and Feedbacks in a Changing Climate
Greenhouse gases, such as CO2 and methane (CH4) help trap heat in the Earth’s atmosphere. Our use of fossil fuels has increased atmospheric CO2, which traps heat near the earth and warms our planet. As a result, the polar regions are losing snow and ice [1]. Land is darker than the white of ice, so ice-free areas absorb heat faster and this in turn melts even more snow and ice. This is called a positive feedback mechanism, which intensifies climate warming. However, ice loss also frees up new space for plant or animal life. Since plants and animals take up carbon to build their bodies, they are examples of carbon sinks. A carbon sink is an area in where there is a net accumulation of carbon which has come from the atmosphere (such as prolific growth of micro-algae; an algal bloom). Plants use atmospheric CO2 to grow, so new ice-free spaces lead to a reduction in atmospheric carbon, reducing climate warming—this is called a negative feedback mechanism [2]. In this way, the sea can provide a lot of negative feedback for climate warming [3].
Sequestration of carbon usually happens through the burial of plants or animals in wet sediments. This is why most fossils are found in rocks that were once sediments of seabeds, lake bottoms, or swamps. In the sea, negative feedback can happen when less of the polar sea surface freezes in winter, resulting in more light penetrating the water so phytoplankton can grow for a longer time. When the phytoplankton die, some of them become buried on the seabed, sequestering the carbon. Others are eaten by animals, and some of these animals are eventually buried in the seabed, too. So, greenhouse gas warming can result in less winter sea ice, which leads to more carbon being sequestered on polar seabeds, thereby reducing atmospheric CO2. Retreating glaciers free up even more space for light and marine life, driving a similar negative feedback. Climate warming can also cause major changes in ice shelves. Ice shelves are where polar ice caps meet the sea and flow into it in the form of huge, floating, frozen rivers. Extensive ice shelves along the Antarctic Peninsula have been breaking up at their seaward edge to form giant icebergs. This not only opens new areas for life to capture and store carbon, but as the icebergs drift away on currents, they release nutrients. These nutrients, such as iron frozen in from dust on the land, fertilize phytoplankton elsewhere in the ocean [4]. Icebergs can also collide with the seabed in what is termed ice scour, crushing benthos putting carbon back into the carbon cycle. Major projects, such as the Changing Arctic Ocean programme (https://www.changing-arctic-ocean.ac.uk/), bring teams of scientists together to try to measure and understand the physical and biological changes that are caused by a warming climate.
How Do We Measure Blue Carbon?
In order to determine whether the loss of sea ice affects the amount of blue carbon, we first had to carefully select the sampling sites. The sampling sites chosen for the Changing Arctic Oceans Seabed (ChAOS) study span the length of the Barents Sea (Figure 1), because it is important to take measurements in locations that have different amounts of past and present sea ice. In other ways, the chosen sites are quite similar, for example in terms of water depth and seabed characteristics. These similarities make it easier to interpret any differences between the blue carbon found at these sites. Sampling is performed each summer, the time when it is easiest for ships to travel through the Barents Sea. Sampling all sites at the same time of year also helps to reduce complicating differences between sites.
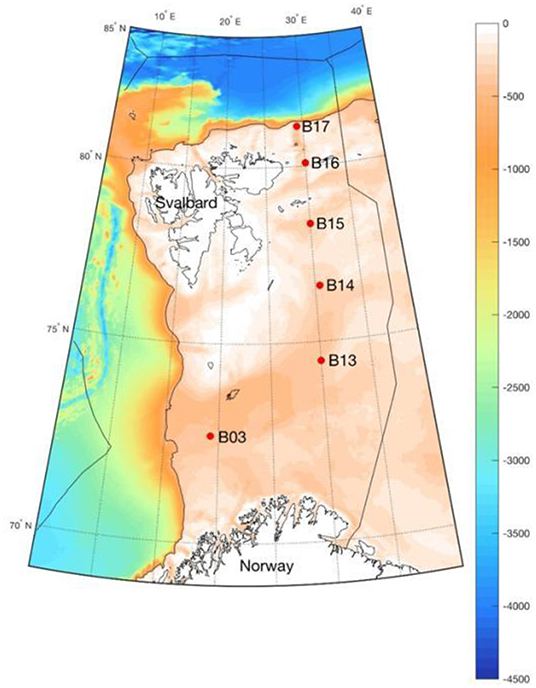
- Figure 1 - Sampling sites of the Changing Arctic Ocean Seabed project in the Arctic Barents Sea.
- Each red dot represents a site where samples are collected. The color scale shows the depth of the seabed in meters.
Phytoplankton can be collected in water samples or plankton nets, and care is required to make sure precise water volumes are investigated, so that density and mass per volume can be calculated. The density, size, and identity of life on the seabed (otherwise known as benthos), can be determined using photographs from a high-resolution camera that is lowered to the seabed on a tripod. The organisms can also be collected in samples of sediment. Chemical tests are then used to investigate how much carbon is present at each depth. Animals are dried and weighed in a way that allows scientists to calculate how much of the weight is made up of soft tissue and how much is made up of skeleton. At each site, many samples are taken to allow for variability in environmental factors, such as sea temperature, water flow, salinity, dissolved oxygen, material of the seabed (such as rocks, sand, or mud), and seabed roughness.
What Can Sampling Tell Us About Blue Carbon?
The sampling procedure described above can provide a lot of information about the amount of carbon present in organisms of different types and sizes from different sites. The method can also provide information on the number or density of each organism type. Calculations can then be made of how much carbon is held by organisms in each sample at each site. If sample 1 contains three clams, 10 worms, and a sea star, the carbon for each organism type can be totaled and all organisms summed to give an overall total. When entered into a spreadsheet or database, this information can be analyzed to provide details about the blue carbon present in the organisms.
Many questions can be answered from this data. In Figure 2, you can see the answer to two of these questions: How much of the carbon in phytoplankton is eaten by benthos; and how much of the carbon in the seabed gets buried?
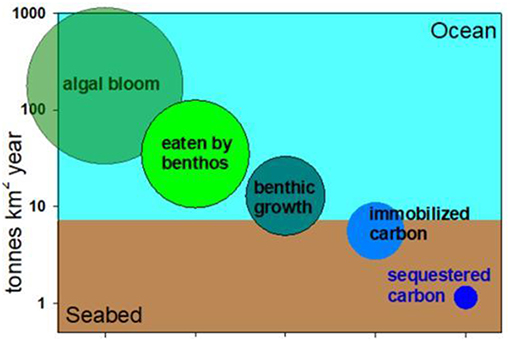
- Figure 2 - A carbon cascade in a polar sea.
- Only a small proportion of an algal (phytoplankton) bloom (left) is eaten by benthos, which are animals living on the seabed. In turn only a small proportion of that turns into animal tissue (benthic growth). Less than half of that carbon is “immobilized” in the skeletons of animals and only half of 1% may be sequestered through burial. Sequestration is defined here as removal from the carbon cycle for more than 100 years.
Many other questions can be answered using the sampling technique we described, including how much does carbon held by benthos vary within and between sites and how does seabed blue carbon vary between different polar regions? All this information provides a context and understanding of our main area of interest: how does polar blue carbon respond to sea ice losses, and what does this mean for blue carbon’s power as a negative feedback on climate change?
What Else Have We Learned?
Work to date has found that blue carbon varies considerably on polar seabeds. Around West Antarctica there is little change in blue carbon over time in some seas, such as the Amundsen Sea, but a lot in others, such as the Weddell Sea [2, 5] (Figure 3). Changes in blue carbon may be caused by wind (Ross Sea), sea ice losses (Scotia Sea) or sea temperatures (South Georgia). The growth of marine animals has increased most over the last decade in shallow waters, where the animals are close to their phytoplankton food [3]. However, iceberg scouring (iceberg collisions with the seabed) has also increased, smashing up the new growth of benthos in the shallows and stopping it from becoming sequestered in the seabed. In deeper water, the growth of benthos has increased less over the last decade, but iceberg scouring is rare below 100 m depth. So although the growth increases of benthos are smaller in deep water than in the shallows, the rarity of deep water iceberg scouring means that these small increases are more likely to eventually be buried and thus sequestered. Giant icebergs breaking off ice shelves are promoting the growth of phytoplankton and helping to increase blue carbon. Creation of a 5,000 km2 iceberg increases blue carbon by 1 million tons—this is like removing the car exhaust output of 400,000 cars for a year [5]. Understanding blue carbon can help scientists to advise policy makers and politicians how to reduce the amount of atmospheric carbon, which may serve to protect our planet from dangerous climate warming.
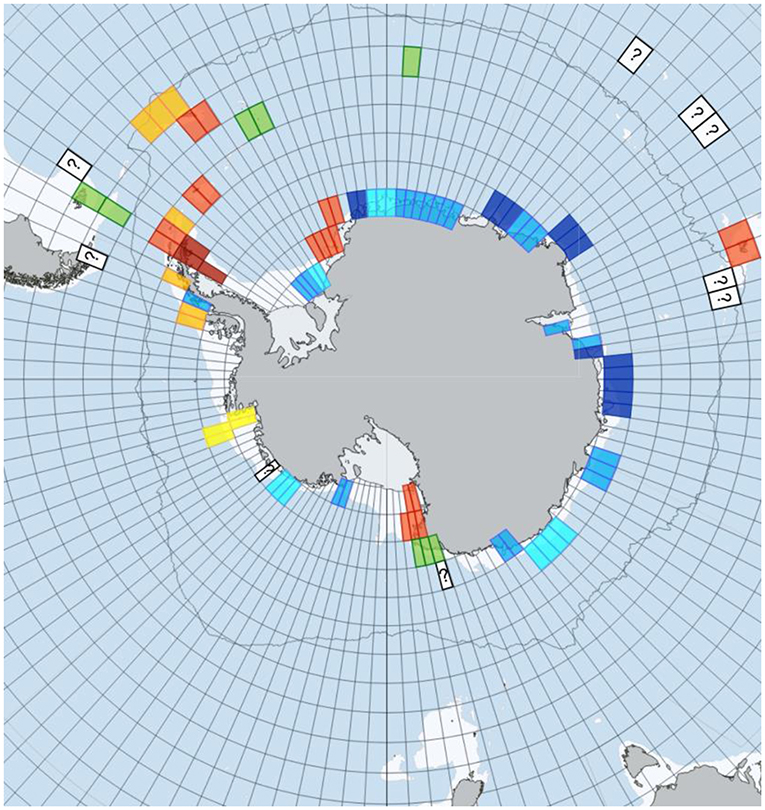
- Figure 3 - Blue carbon change around Antarctica from 1995 to 2015.
- Red represents high increase of blue carbon, orange represents moderate increase, yellow represents minor increase, green represents little change in blue carbon and dark blue represents a decrease in blue carbon [5]. Question marks are samples currently under investigation and no information is known for light blue background squares.
Glossary
Blue Carbon: ↑ Carbon stored by marine life.
Phytoplankton: ↑ Tiny plants or micro-algae that capture carbon.
Carbon Capture: ↑ Fixing carbon dioxide gas into storage away from Earth’s atmosphere.
Carbon Sequestration: ↑ Removal of carbon from carbon cycling (e.g., by burial).
Negative Feedback: ↑ The mitigation or (reduction) of an effect by its own influence.
Ice Scour: ↑ Collisions between icebergs and the seabed.
Benthos: ↑ Organisms (mainly animals) that live on the seabed.
Conflict of Interest
The author declares that the research was conducted in the absence of any commercial or financial relationships that could be construed as a potential conflict of interest.
Acknowledgments
All the participants of NERC programme Changing Arctic Oceans research cruise JR17001 were thanked. Finally thank you to reviewers, a science mentor to reviewers, and Jo Barnes for greatly improving the text of the manuscript.
References
[1] ↑ Parkinson, C. L. 2014. Global sea ice coverage from satellite data: annual cycle and 35-yr trends. J. Clim. 27:9377–82. doi: 10.1175/JCLI-D-14-00605.1
[2] ↑ Housset, J. M., Girardin, M. P., Baconnet, M., Carcaillet, C., and Bergeron, Y. 2015. Unexpected warming induced growth decline in Thuja occidentalis at its northern limits in North America. J. Biogeogr. 42:1233–45. doi: 10.1111/jbi.12508
[3] ↑ Barnes, D. K. A. 2018. “Blue carbon on polar and subpolar seabeds,” in Carbon Capture, Utilization and Sequestration, ed R. K. Agarwal (London: IntechOpen). p 37–55. doi: 10.5772/intechopen.78237
[4] ↑ Duprat, L. P. A. M., Bigg, G. R., and Wilton, D. J. 2016. Enhanced Southern Ocean marine productivity due to fertilization by giant icebergs. Nat. Geosci. 9:219–21. doi: 10.1038/ngeo2633
[5] ↑ Barnes, D. K. A., Fleming, A., Sands, C. J., Quartino, M. L., and Deregibus, D. 2018. Icebergs, sea ice, blue carbon and climate feedbacks. Phil. Trans. R. Soc. A 376:20170176. doi: 10.1098/rsta.2017.0176