Abstract
I am pretty sure that you regularly experience rainfall and sometimes get pretty wet since you do not have the appropriate clothing! Rainfall is both a needed resource, since it fills rivers and provides fresh water, and a potential threat with heavy rainfall leading to (possibly rapid) flooding. A much needed step to understand better this natural phenomenon is to properly measure it. It turns out to be pretty tricky because rainfall is extremely variable in time and space. In this paper, you will learn the functioning of three rainfall measurement devices providing cumulative rainfall depth (tipping bucket rain gauges), size and velocity of falling drops (disdrometers), or rainfall maps (weather radars).
Rainfall is one of the most commonly shared experiences on Earth, and I will bet you regularly witness it. Sometimes you are ready with appropriate clothing and sometimes not! Rainfall is sometimes long and light, sometimes short and heavy, and sometimes long and heavy. When rainfall is long and heavy, it can lead to rapid flooding, which is dangerous for the nearby population. Rainfall is also necessary, since it provides water to plants and ultimately fills rivers. Because rainfall is both a needed resources and a threat, it is important to better understand this natural phenomenon.
It is very likely that you have already noticed that rain is variable over time. When you stay in the same place, it does not rain there all the time. Even during a rainfall event, the strength of the rainfall can constantly change from very light to very strong. The stronger periods of rainfall are usually quite short. This kind of variability in rainfall is also visible on a larger scale, because as you know, there are wetter months or years and dryer ones. There is also variability in where rainfall occurs. It can rain a lot in one location and not at all, or with a very different strength, a few kilometers away or even a few hundred meters away.
Variability is a basic feature of rainfall that makes it complex to measure. Meteorologists (people who study weather) and researchers have developed numerous measurement devices that enable them to study the extreme variability of rainfall. We will explain the functioning of the three most commonly used devices. The data we present were collected on the campus of Ecole des Ponts ParisTech, where I work.
How Do We Measure the Amount of Rain That Falls?
The most common rainfall measurement is the total rainfall depth during a given period, expressed in millimeters (mm). For instance, we might want to know how many millimeters of rain fell over the course of 1 h, 1 day, 1 month, or 1 year.
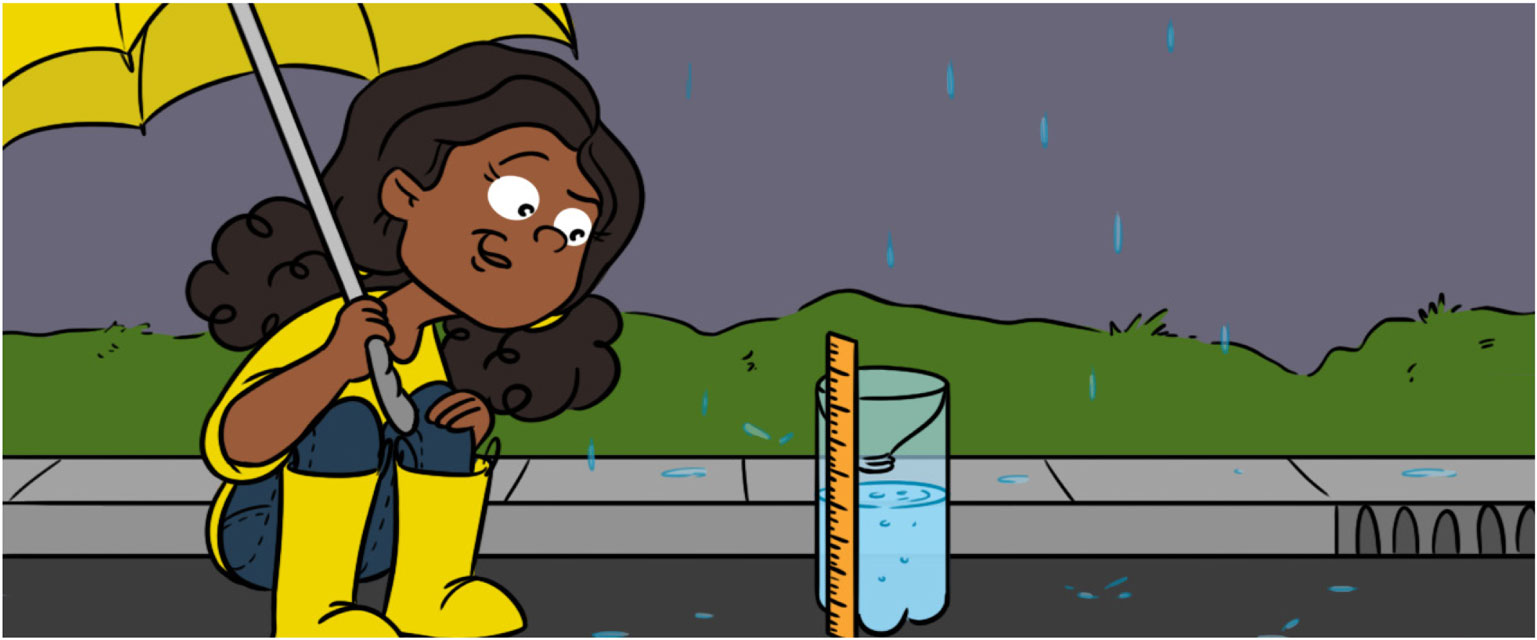
You can easily get a rough measurement of rainfall depth at home. Just follow these steps: (1) Take a bottle with smooth sides, cut off the upper part and turn it upside down on the top of the bottle, to create a sort of funnel (see Figure 1A). (2) Stick a ruler on the side of the bottle and fill the bottle of water up to the zero mark on the ruler, which should be above the bumps at the bottom of the bottle. The bumps would otherwise affect the measurement. (3) Bring your rain gauge outside, as far as possible from buildings and trees. (4) Regularly note the water level (for example, every morning at 8:00 a.m. before going to school) to collect your own data. If you plan to take your measurements during the summer, some of the water inside the bottle will evaporate (up to few mm a day) and this will affect your measurements. To avoid this, you can add a thin layer of oil to the water. Since it is lighter than water, the oil will float on the top of the water and prevent evaporation. The measurements you get from your rain gauge will tell you how much rainfall occurred over a certain period of time.
- Figure 1
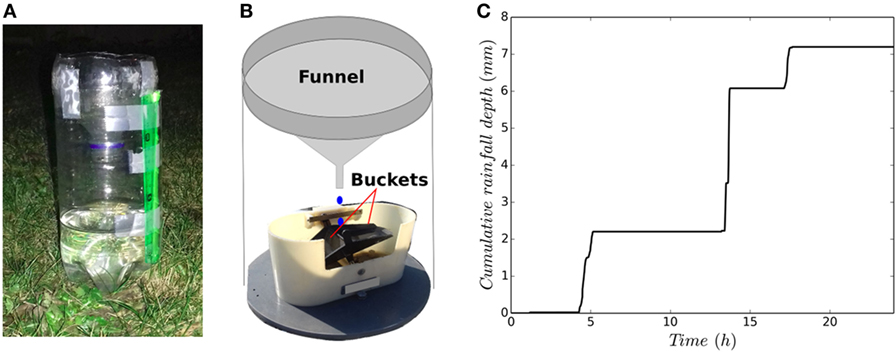
- A. A homemade rain gauge. B. A professional tipping bucket rain gauge. C. An example of data obtained with a tipping bucket rain gauge, showing how much rain (in mm, Y-axis) fell over time (X-axis) on 27 June 2017 over the Ecole des Ponts ParisTech campus. The time corresponds to the clock time of that day. The quickest increase, corresponding to the stronger rain, occurred between 13:00 and 14:00.
Professionals use more complicated devices called tipping bucket rain gauges and you can see one in Figure 1B. This rain gauge looks like your homemade device, except that there are two buckets beneath the funnel. The water falling into the rain gauge will be routed to one bucket by the funnel. Once that bucket is filled, usually after 0.2 mm of rain falls, it is designed to automatically tip, meaning that the other bucket will now be beneath the funnel. The process starts all over again with this other bucket, until it is filled and tips. The rain gauge records the time of all the bucket tips, which will give the researcher data about how quickly the rain falls over time. Figure 1C shows an example of the data that can be obtained using a tipping bucket rain gauge. These observations were made on 27 June 2017. The rainfall depth (in mm) quickly increased between 13:00 and 14:00, meaning that it rained a lot during that period. During a period of light rain, this device is not very precise. For example, between 05:15 and 13:00, all you can tell is that 0.2 mm of rain fell (one tip of a bucket), but you do not know exactly when that rain fell. If there is a lot of wind, that can also affect the accuracy of the device.
How Do We Measure the Size of Rain Drops?
What is rainfall made of? Rain drops, obviously! Rain gauges are not sensitive enough to be able to take measurements of individual rain drops. To start collecting data about drops and their size, you need a device called a disdrometer.
Before describing a “real” disdrometer, here is how you can make one at home (see Ref. [1] for a more detailed description). Follow these steps: (1) Take a plate and put a few millimeters of flour all over it. (2) When it is raining, go outside with the plate covered, uncover it for a few seconds so some drops can fall on it and create small craters, then go back inside. (3) Analyze the outcome.
You will observe something similar to what is shown in Figure 2A, and you will notice that drops do not all have the same size—some are very small and some are very large! Actually, the craters are bigger than the drops because the water slightly spreads after it hits the plate, but they still enable you to directly visualize the great variety of drop sizes, even during a very short time.
- Figure 2
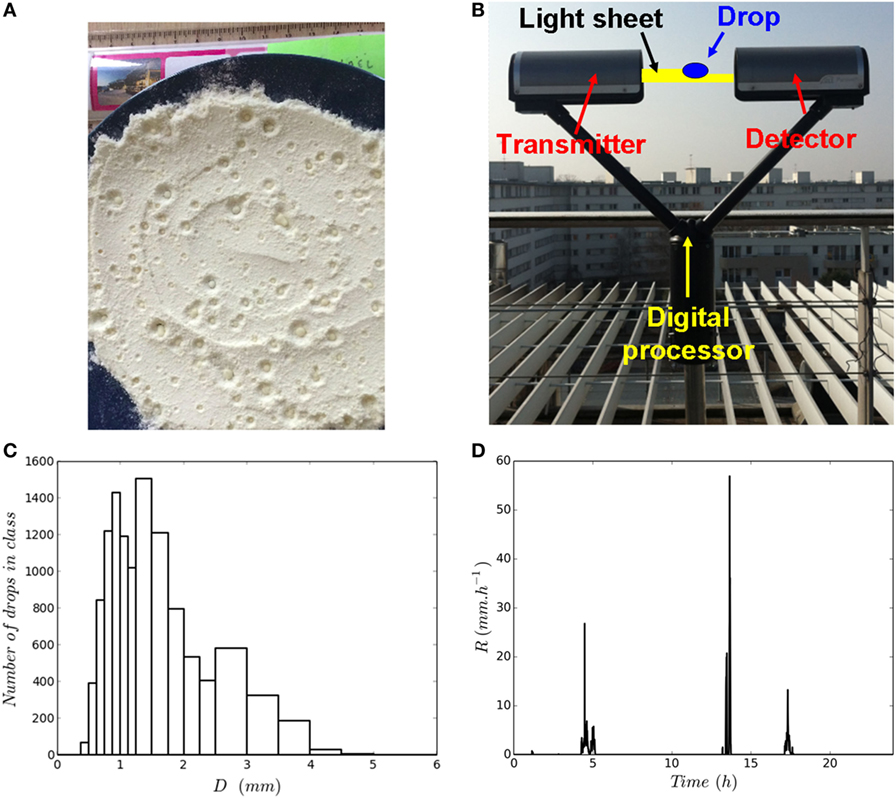
- A. Measurements obtained with a homemade disdrometer, made of flour on a plate. B. An optical disdrometer. It consists of a transmitter generating a light sheet toward the receiver. When a drop falls through the device, the receiver gets shadowed (see Ref. [1, 2] for a scientific paper using this device). C. Disdrometer data showing the number of drops, based on drop size classes, measured during a rainfall event that occurred on 27 June 2017 over the Ecole des Ponts ParisTech campus. On the X-axis, you can see size of the diameter classes and on the Y-axis, the number of drop for that class. As you can see the width of the various classes is not always the same. They are smaller for the small drops which are more numerous D. Rainfall rate in mm/h (Y-axis) over time in h (X-axis), during the same rain event shown in C. This graph shows that three rainfall peaks occurred during that day.
As you can imagine, meteorologists and researchers wanted a device more automatic and precise than the flour plate! They now mainly use optical disdrometers, which function as shown in Figure 2B. This kind of disdrometer is made of two parts: a transmitter and a receiver. The transmitter generates a sheet of light a few mm in height. The receiver is aligned with the transmitter, meaning that when it does not rain, the receiver receives all of the light. However, when a drop passes through the sheet of light, guess what happens? The amount of light received is smaller, because a portion gets blocked by the drop. If the drop falls very quickly, the duration of the decrease in received light will be short. This is how the downward velocity (speed) of the falling drop is estimated. If the drop is large, the signal measured by the receiver will decrease more than with a smaller drop. This is how drop size is estimated. In this way, the size and velocity of each drop passing between the transmitter and the receiver are measured.
Rain drops can be as large as 5–6 mm. Larger drops are split during their fall. Indeed at this size they are not strong enough to resist the power of the wind they feel when falling rapidly. The velocity at which drops fall increases with their size: 1-mm drops fall at 3 m/s while 5-mm drops (very large ones) fall at 8 m/s. Figure 2C shows the number of drops of each size that fell during a storm that occurred on 27 June 2017 in the Paris area. Small drops are much more numerous than large ones. But do not forget that a 1-mm drop has a volume 125 times smaller than a 5-mm drop! This means that, although they are not numerous, large drops account for a lot of the rainfall depth. Let us now consider successive time steps of 30 s. Then, by adding the volume of all the drops that passed through the disdrometer during a 30-s time step, you can estimate the amount of rain depth that fell during each 30-s time step. This estimate will give you the rain rate, and it is usually expressed in mm/h. The rain rate gives you an idea of the strength of the rainfall. The rain rate corresponds to the rain depth that would accumulate over 1 h, if the rain rate remained constant during this hour (which actually never occurs in real life). Figure 2D shows the rain rate (in mm/h), with 30-s time steps, during the same 27 June 2017 event. The strong variability in rain rate can be easily seen in the graph.
How Do We Make Rainfall Maps?
Until now, we have only discussed devices that can provide measurements of rainfall at a precise location. Both rain gauges and disdrometers only give you an idea of the rain that fell on them, but not on the surrounding areas or 20 km away. To create rainfall maps, which are maps with the amount of rain that has fallen over a given timespan (for example, 5 min or 1 h) at multiple locations, we need to rely on weather radar.
The functioning of weather radar is summarized in Figure 3A. First, the radar equipment transmits an electromagnetic wave in one direction, which transfers some energy through the atmosphere. When this energy reaches a water drop in a cloud, a tiny part of that energy is sent back to the radar equipment. Then, the equipment measures this very small amount of energy received from all the drops. Using special computer programs, it is possible to convert the amount of energy received into the amount of rain. It is important to remember that a radar does not directly measure the amount of rain, but instead measures the amount of energy sent back by the drops. This conversion of energy into the amount of rain turns out to be tricky and people are still doing research to improve it [3]. For example, currently the drop size distribution and drop location within a radar pixel are assumed homogeneous. It is an over simplification of the reality which can affect the measurements [4]. The computer program enables the radar equipment to estimate the amount of rainfall in places that are far away it. The radar equipment can spin around and can also change its angle, so that it can estimate the rain rate in its entire surroundings.
- Figure 3
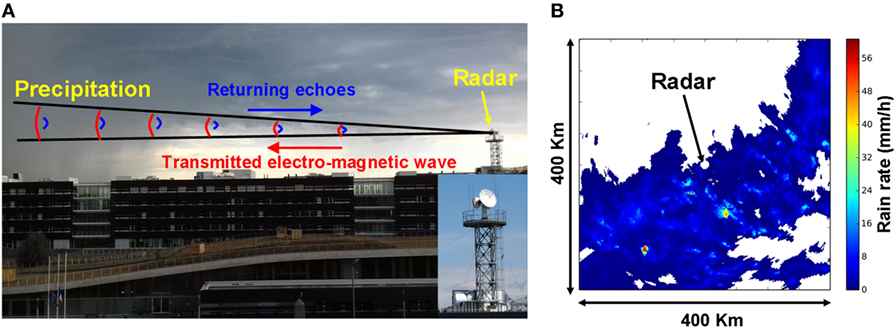
- A. Weather radar works by sending a wave in the atmosphere where the drops return a portion of it to the radar. The equipment shown is located on the campus of Ecole des Ponts ParisTech. B. A rainfall map created using data obtained with this radar on 15 September 2016 over 3 min and 40 s. Two very intense rainfall cells are visible on the lower part of the map.
Depending on the type of radar, it is possible to estimate rainfall up to 150–200 km from the radar equipment. Numerous developed countries have a network of radar equipment. By combining the data collected by all of the different radar equipment, we can obtain maps of rainfall over the whole country. Figure 3B shows an example of a rainfall radar map measured by radar equipment at Ecole des Ponts ParisTech. The variability of the rainfall can be seen—notice the two very intense cells on the lower part of the map, in yellow and red.
What Did We Learn?
Rainfall is extremely variable, both over time and between different locations, which makes it very difficult to measure. A rain gauge basically collects water falling on it and records the change over time in the rainfall depth, which is usually expressed in mm. You can get much more detailed information with disdrometers. A drisdrometer generates a sheet of light that is partially blocked when a drop falls through it. The size and velocity of each drop passing through the sheet of light is estimated from the amount of light that is blocked. To create rainfall maps that measure rainfall over multiple locations, we have to use radar, which basically sends some energy into the atmosphere and analyses the portion of that energy that is returned to it when it bounces off the rain drops in the atmosphere. There are still a lot of scientists working ways to accurately measure rainfall over time and in multiple locations at once.
Glossary
Tipping Bucket Rain Gauges: ↑ A device that measures cumulative rainfall depth (in mm) at a precise location.
Disdrometer: ↑ A device that measures the size and velocity of each rain drop passing through it.
Weather Radar: ↑ A device that enables to compute rainfall maps over a large area for various time steps (e.g., 5 min, 1 h, and 1 day).
Homogeneous: ↑ Being of similar kind everywhere.
Conflict of Interest Statement
The author declares that the research was conducted in the absence of any commercial or financial relationships that could be construed as a potential conflict of interest.
Acknowledgements
Authors greatly acknowledge partial financial support form the Chair “Hydrology for Resilient Cities” (endowed by Veolia) of Ecole des Ponts ParisTech.
References
[1] ↑ Gires, A., Muller, C. L., le Gueut, M.-A., and Schertzer, D. 2016. Making rainfall features fun: scientific activities for teaching children aged 5–12 years. Hydrol. Earth Syst. Sci. 20:1751–63. doi:10.5194/hess-20-1751-2016
[2] ↑ Gires, A., Tchiguirinskaia, I., and Schertzer, D. 2016. Multifractal comparison of the outputs of two optical disdrometers. Hydrol. Sci. J. doi:10.1080/02626667.2015.1055270
[3] ↑ Berne, A., and Krajewski, W. F. 2013. Radar for hydrology: unfulfilled promise or unrecognized potential? Adv. Water Resour. 51:357–66. doi:10.1016/j.advwatres.2012.05.005
[4] ↑ Schertzer, D., Tchiguirinskaia, I., and Lovejoy S. 2012. “Getting higher resolution rainfall estimates: X-band radar technology and multifractal drop distribution,” in Proceedings of the Weather Radar and Hydrology Symposium Held in Exeter, UK, April 2011. (Vol. 351), IAHS Publ. p. 672.