Abstract
A glacier is a large moving body of ice. Glaciers are natural phenomena that occur at the colder places of this Earth. When you travel to a glacier and look at it, you will see an enormous collection of ice, which lays in between mountains tops. At first sight, nothing seems to be moving, but this is not the case. Ice is actually a very thick liquid, and moves like honey, but very slowly. If you want to see a glacier move, you will need to wait a long time. But if you take a picture and come back some days or weeks later to take a second picture, the ice will have moved, and this can be measured if you compare both images. When we research glaciers we use the same technique, but we use pictures from satellites. The satellites fly over every part of the Earth and can see any glacier. This makes it possible for us to look at the flow of glaciers anywhere on Earth.
What Makes a Glacier?
You might wonder how glaciers come to exist and why they flow. Glaciers are made of snow that falls in the high mountains (Figure 1). This snow in the valleys between mountains does not melt and with every snow storm the pile of snow grows in size. Meters of snow pile up, pressing and compacting snowflakes into ice. Then, this pack of ice flows downhill: because it is very heavy and it slips over the rock underneath it. Lower within the valley the temperature is higher, so the ice melts, transforming the ice crystals to water droplets, which come together to form a river that drains into a lake or the ocean.
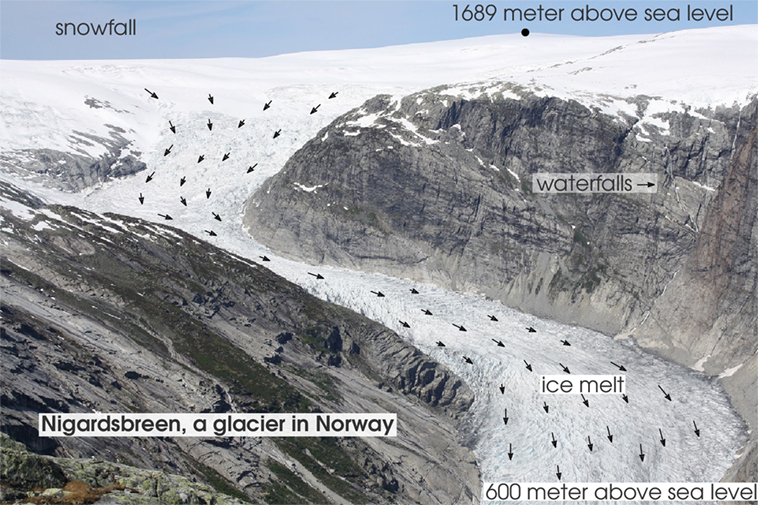
- Figure 1 - A picture of a part of Nigardsbreen, a glacier in Jostedalsbreen National Park, Norway.
- The different parts of a glacier are labeled in the figure. At the top of the glacier, it is high and cold, and snow falls. Due to its own weight, the snow compresses to ice and slides down the hill, between the valley walls. Once it gets to the lower part of the valley, the temperature is much warmer and the ice melts. Photo by Markus Engelhardt.
Glaciers are important and interesting to study. They are important because glaciers are big storages of fresh water, so they can be a water resource for many people who live downstream on the glacial river and are dependent on the water carried by the river. Furthermore, glaciers are interesting because they can tell us something about the past weather conditions and long-term weather trends. This means that glaciers can help us to learn about the climate. How? Well, when there is more snow than usual, there will be more ice generated. But when it is warmer than usual, more ice will melt away.
How Does a Glacier Flow?
The movement of ice from the top of the glacier down into the valley is complicated to study. There are two processes involved in this movement, called internal deformation and sliding, and both are complicated. The first component, internal deformation, has to do with the behavior of the ice as a very thick liquid. The amount of internal deformation is dependent on the thickness and temperature of the glacier ice, and most of the time these things are unknown. The second component is sliding, which is the friction between the bottom of the glacier and the rock underneath it. There might be a small layer of water or river channels present under the glacier.1 This water reduces the friction between the ice and the rock and makes it easier for the ice to slide. However, the availability of water underneath a glacier changes over time. For example, in spring when it is warm and sunny, meltwater (water from melting ice) increases. So, sometimes there might be rivers running underneath the glacier, but at other times the water might be trapped and ponds are formed in cavities.
Calculating Glacier Movement
When we see, using pictures, that a glacier is moving over time, that movement is a combination of the flowing of the ice (since it’s really a super thick liquid) and the sliding of the ice over the rock underneath. When we look only at the honey-like flowing of the ice, it mostly depends on the thickness of the ice and the slope of the valley. Typically, a mountain glacier has a thickness of around 100 m, while the slope of most glacial valleys is in the range of 2–20°. With these numbers, we can estimate of how much a glacier would move in a day, due to its internal deformation. This is called Glen’s flow law. For some examples of how Glen’s flow law works, see the attached spreadsheet.2 However this is only one component of the flow, the other component, the one due to sliding over the glacier bottom, is still unknown. But with satellites we can measure the combined result.
Measuring Glacier Movement
Over time, the thickness of a glacier changes, due to melt or snow. Typically, this ranges between 2 and 3 meter, gain or loss, every year. This sounds like a big difference, but not in relation to the total thickness of the glacier (check for yourself in the spreadsheet, by looking at the speed of the glacier as it changes with thickness!). The calculated honey-like movement of the glacier predicts a single number for the glacier speed and thus says the glacier will move constant over time. However, glaciers DO change speed—we know this from measurements. Even more than 100 years ago, the movement of glaciers was measured by comparing the movement of sticks stuck in the glacier with surrounding boulders, which didn’t move. These measurements showed that the speed of the glacier’s movement changed between spring and summer. Nowadays, with satellite navigation and telecommunication, we can plant GPS-stakes on a glacier and let the stakes measure, record and send us data about the glacier’s movement. One such stake installation was set up by Jack Kohler from the Norwegian Polar Institute. He installed several GPS-stakes on Kronebreen, a glacier on the island of Svalbard, which is in the High Arctic. Figures 2 and 3 show him on this glacier, installing a GPS-stake. These pictures were taken from a helicopter because, as you can see, the glacier is full of enormous crevasses. Imagine how difficult it is to conduct research on a glacier—traveling over them is very dangerous. If you are not cautious, you might easily fall into a giant crevasse!
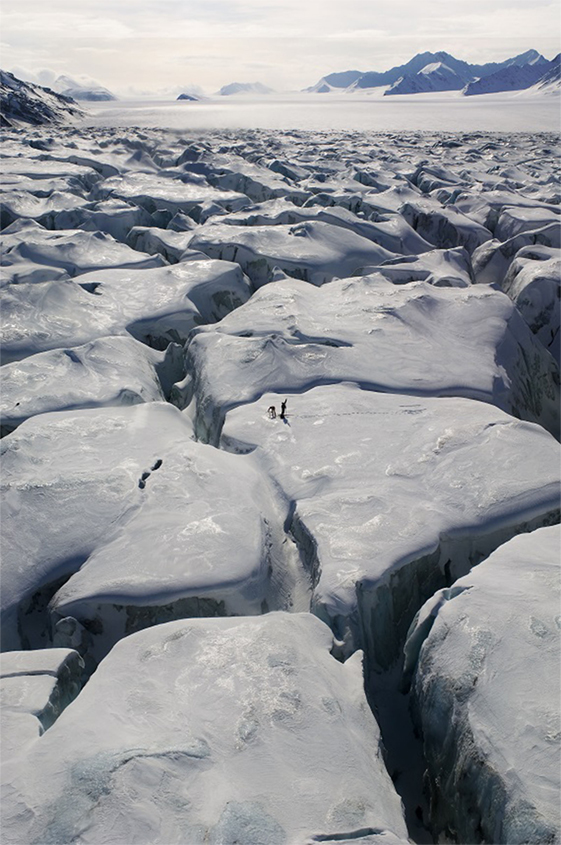
- Figure 2 - Jack Kohler and Kirsty Langley installing a GPS-stake on the Kronebreen Glacier.
- Photo by Elvar Orn Kjartansson.
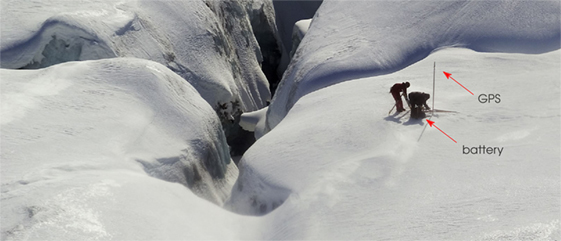
- Figure 3 - A close-up of Jack and Kirsty while they install the GPS-stake.
- You can see the GPS attached to the stake and next to it is a battery to supply the instruments with power. Photo by Elvar Orn Kjartansson.
When we look at the data from a GPS-stake, shown in Figure 4, we see the path of the glacier is not a straight line. Over the time the data was collected, the stake moved more than 300 meter, but our calculation of the movement predicted, using Glen’s flow law, is that the glacier should only have moved 250 meter! The extra movement came from the sliding of the glacier over the rock underneath it. If we subtract the movement measured on the glacier surface from movement calculated by Glen’s flow law, we get an idea about the influence of sliding. When the lines get further apart, then the glacier is not only flowing like honey but also slides a lot over its rock bottom. But over the whole time period, sliding is not always happening. Because, as you can see in Figure 4, the sliding is not constant and at certain times the two lines don’t have the same slope. These are the periods, where a lot of sliding is occurring, which can be of great help in understanding what is happening underneath a glacier.
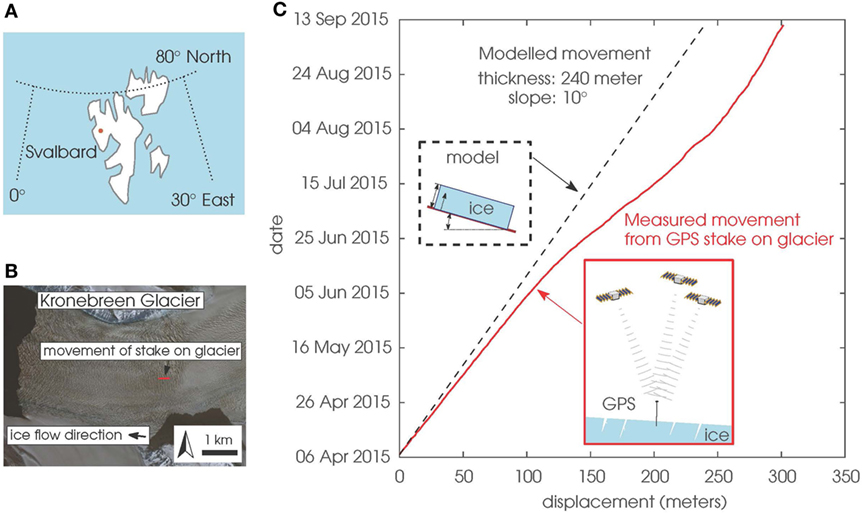
- Figure 4
- A. A map of Svalbard. The red dot indicates where the Kronebreen glacier is located. B. Satellite image of the Kronebreen glacier. In red, you can see the path the GPS-stake traveled in the summer of 2015. This information is from the GPS-stake shown in Figure 3. C. In red, the movement of the stake from Figure 3 is plotted as traveled distance. The X-axis shows the amount of movement, in meters, while the Y-axis shows the date. The dashed line shows the movement of the glacier as predicted by Glen’s flow law. You can see that the slope of the lines is similar in the beginning, but in June the line of the GPS-stake tilts. This is due to an increase of sliding of the glacier over its slippery rock bottom. The slippery bottom comes from melt water, as in June it is warm and the glacier is melting.
Help from Space
If we want to understand the behavior of many more glaciers, placing GPS-stakes on every glacier would be too difficult. In the whole world, there are almost 200,000 glaciers. It is simply not practical and also would not look very good to decorate all glaciers with GPS-stakes! Fortunately, there are several satellites orbiting our planet. These satellites take pictures of the Earth’s surface, and these pictures can be used to measure glacier movements, as an alternative to GPS-stakes on the ground.
So, it is very important to figure out whether we can use satellite images to get the same kind of details about glacier movement that we get from GPS-stakes. And that is the subject of our study: measuring glacier movement from pictures taken from space. We use images from the SPOT5 satellite. This satellite has been in space since 2002 and when we did our study it was orbiting in such a way that it passed the same location every 5 days for a full summer season. This was a perfect opportunity to test our method, so we asked the European Space Agency (ESA) if they could take pictures over Kronebreen and a glacier in Canada, called Kaskawulsh. The ESA said yes and the collected images were processed by the French space agency (CNES), which owns the satellite.
Movement of a Remote Glacier in Canada
We’ll tell you about the results we found by looking at satellite images of the Kaskawulsh Glacier. This glacier is in western Canada, in the Kluane mountain range (Figures 5A and 5B). In order to see the glacier movement with the help of satellite images, we constructed a new type of image. We used the same approach as we did using the GPS-stakes. However, instead of just looking at one point from a GPS-stake, we looked at all the color-pixels along a line in the satellite image. Then every satellite image, which is 5 days apart, is stacked on top of the former color line. We call this type of image a space-time slice. When you first look at it, it might seem like a very strange image, but once you understand what these patterns mean, you will be able to see the movement of Kaskawulsh Glacier!
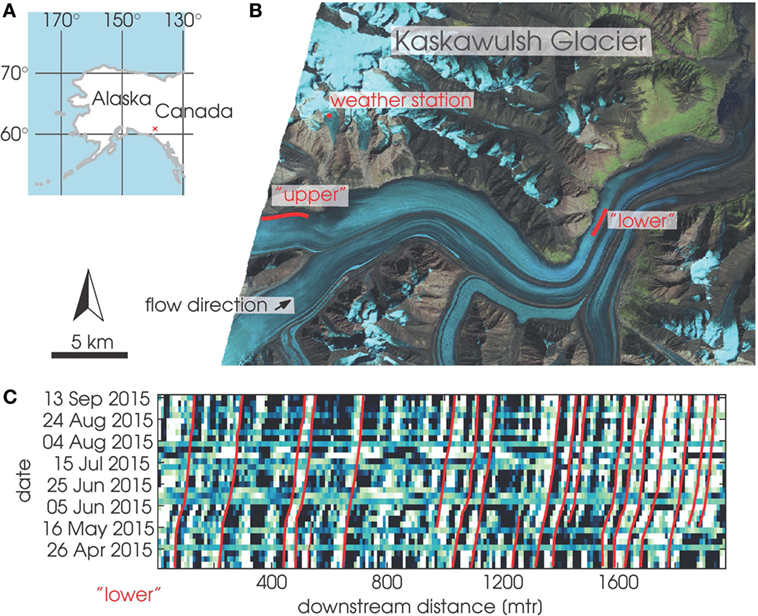
- Figure 5
- A. Map of the location of Kaskawulsh Glacier, which is in Canada, close to the Alaskan border. B. Satellite image of the Kaskawulsh Glacier. In red, you can see the movement of the “upper” and “lower” sections of the glacier. The location of the weather station is also indicated. C. A space-time slice from the “lower” part of Kaskawulsh Glacier. The X-axis shows the amount of movement, in meters, while the Y-axis shows the date. Now, the black-green-white patterns within the image are from the different satellite images. These go over the moving glacier and should have similar curved lines as in (4C). However, for the most part, these patterns are not continuous lines. This is because the look of the glacier changes. For example, in spring it is covered by snow, but in autumn it is only ice and rocks on the surface. Or it can happen that the satellite only sees clouds. Thus, we drew red lines by ourselves on top of this pattern. If you look at these red lines, you see the lines are not straight. The more tilted lines mean more movement of the glacier, thus also on this glacier there is a period where there is more movement due to sliding.
Figure 5C shows one a space-time slice image for a section in the higher part of Kaskawulsh Glacier. When looking at this image, you should keep in mind that we are interested in speed. Speed is the movement over a certain amount of time. When a certain feature on the glacier, such as a rock, moves its position (Y-axis) for a certain time amount (X-axis), we will be able to observe that. For example, if the rock is lying still next to the glacier it will have no speed; there will be no movement over time. Thus, the rock will stay at its place and this will result in our plot as a straight vertical line. However, if the rock lies on the glacier surface there is some movement, and this line will have a tilt. This is what you see in the image as well!
Different Parts of the Glacier Move at Different Periods
The lines on our plot can tell us about the speed of the glacier over time. If we do this for two different places on the Kaskawulsh Glacier, called “upper” and “lower,” we can see a difference between the two places in Figure 6. In early spring, the glacier moves roughly 1 meter per day. Then, all of a sudden, it increases to 3 meter per day, then, the speed drops again until it is almost as low as 1 meter per day. Close to the “upper” section, Gwenn Flowers from Simon Fraser University in Vancouver placed an automatic weather station. The temperature data recorded by this station is also plotted in Figure 6. This data can help us understand why this speed-up is occurring. In late winter, temperatures are –10°C (14°F). In spring, the temperature increases quickly, to above freezing. So, this might confirm what we know: the meltwater that ends up below the glacier is able to increase the ice speed. You can also see a difference between the “lower” and “upper” plots. When you look at Figure 6, you will see vertical line and arrows drawn in both graphs. These lines indicate the start of the speed-up. In the “upper” figure, you can see that the speed-up began several days later than it did in the “lower” section, thus the lower part of the glacier was already moving fast before the upper part started speeding up.
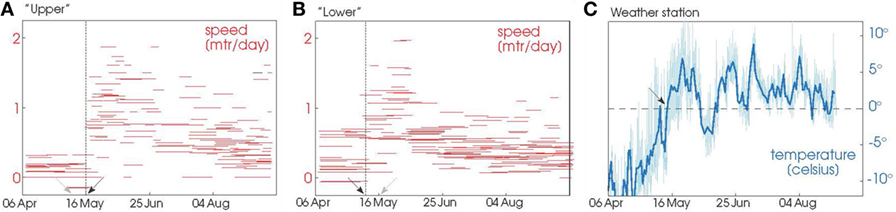
- Figure 6
- A. Speed estimation at the “upper” section of Kaskawulsh Glacier. The location of this section is shown in red in Figure 5. The black vertical line indicates the first time an increase in speed was seen, which was on the 16th of May. B. Speed estimation at the “lower” section of Kaskawulsh Glacier. The location of this section is also shown in red in Figure 5. The vertical line shows the first time an increase in speed was seen in this part of the glacier, which was several days before the 16th of May. The black arrow points toward this date, while the gray arrow is pointing to the date when the speed occurred in the “upper” section. This means that the lower part of the glacier started moving before the upper part of the glacier did. C. The temperatures recorded by the nearby weather station. The location of the station can be seen in Figure 5. The times when the temperature went above the melting point of water (0°C) are roughly the same as the times when the glacier speed-ups occurred.
This phenomenon of a speed-up that moves from the “lower” regions of the glacier to the “upper” regions is related to the spring melt, which starts in the “lower” regions and climbs up as spring continues. This elevation-dependent speed-up was previously observed on the “upper” and “lower” regions of this glacier, using GPS-stakes. Now we know that we can also quickly see this from space!
What Did We Discover?
As you have seen, it is possible to see changes in speed of a glacier that is far away in a remote part of Canada. Before satellite data existed, scientists had to travel to these glaciers, which is a long and difficult journey. But now we can use satellites, and this makes it possible to collect information from a lot more glaciers and through that information we can get a better understanding of how glaciers flow and when they speed-up.
With this information, we can try to figure out the math behind the friction underneath a glacier, between the bedrock and the ice, and come up with a mathematical law to describe this friction. Several ideas for such a law have been proposed, but it is still difficult to decide which one is right. The effect of meltwater needs to be included into such a law. This makes the law very complicated, because the amount of meltwater changes over time. It is also very difficult to see what is happening underneath such a thick layer of ice. This makes it very difficult to test the different laws. Hopefully, our information from space might help to test which law describes the speed-up best, and by doing so, maybe we can help scientists to understand what will happen in the future with these big ice masses.
I hope you have learned something from the work we have been doing, and if you are ever so lucky to visit a glacier, remember that, although the ice does not seem to be moving, it certainly does so! And not only that, the ice even reacts to the change from cold winter to warm summer weather.
Glossary
Friction: ↑ Friction is the resistance of motion when one object moves against another. This resistance can be tested by putting a book on your hand. By tilting the palm of your hand, the book will slide off. The angle at which the book starts to slide depends on the roughness of your hand. When your hand is wet, the book slides off more easily, because there is less friction than there is on a dry hand.
Slope: ↑ The slope describes how steep a straight line is.
Glen’s Flow Law: ↑ The honey-like flow behavior of a piece of ice can be described mathematically. In this way, we are able to predict what the ice will do in different situations. In order to do so you need to measure the flow behavior of ice. This was done at different temperatures in a laboratory by John Glen [1]. With these numbers, John Nye [2] came up with an equation that describes the behavior of a large block of ice on a slab, see also the attached spreadsheet: http://folk.uio.no/basal/frontiers/ice.html.
Satellite: ↑ A satellite is a vehicle full of sensors, which circles in space around the Earth, just like the Moon does. It can have a camera onboard that takes images and sends them back to Earth.
GPS-Stakes: ↑ GPS stands for “Global Positioning System” and is an electronic device that uses satellite radio signals to calculate its position. It can do that anywhere on Earth. A GPS-stake is a long aluminum pole with a GPS antenna on top and a large battery on the bottom. This long aluminum pole gets drilled deep into the ice, so it is firmly attached to the glacier. Almost 2 m of this pole still sticks out, so that the GPS antenna will not be covered by snow in the winter.
High Arctic: ↑ The northern part of the Earth is called the Arctic. This part of the world gets less sunlight than the middle part of the Earth, so it has a colder climate. Because it is so cold, it is very hard for plants to grow. Therefore, the types of plants change when you travel from the middle part of the Earth northward. This gradual change can be split up in different zones. For the Arctic, there are two zones: the Low Arctic, where it is cold but it is not cold enough for trees to stop growing, and the High Arctic, where trees can no longer grow. In the High Arctic, the land is mostly rocky and has only small plants and moss.
Orbit: ↑ An orbit is the movement of a satellite around the Earth or any other planet.
Automatic weather station: ↑ Instruments that can measure all kind of things about the weather. These things include wind speed, wind direction, temperature, humidity, sunlight intensity, surface reflectance, and many more. All these instruments are mounted on a rig and placed on the glacier surface. The rig needs to be big, so it does not get blown against the ground. It also needs to be tall, so it will not be snowed in! Because the sensors are on all the time, the station has big batteries and solar panels to operate. Every summer, a glacier researcher visits the station to see if all the instruments are still functioning and collects the data that was saved on a disk in the station.
Conflict of Interest Statement
The authors declare that the research was conducted in the absence of any commercial or financial relationships that could be construed as a potential conflict of interest.
Original Source Article
↑ Altena, B., and Kääb, A. 2017. Weekly glacier flow estimation from dense satellite time series using adapted optical flow technology. Front. Earth Sci. 5:53. doi:10.3389/feart.2017.00053.
References
[1] ↑ Glen, J. W. 1952. Experiments on the deformation of ice. J. Glaciol. 2:111–4. doi:10.1017/S0022143000034067
[2] ↑ Nye, J. F. 1952. The mechanics of glacier flow. J. Glaciol. 2:82–93. doi:10.3189/S0022143000033967
Footnotes
[1] ↑ Because ice is less dense than water: you can test this yourself, by putting ice in a glass of water—the ice will float.
[2] ↑ See the included Excel-file, so you can experiment yourself: http://folk.uio.no/basal/frontiers/ice.html.