Abstract
The air we breathe is composed of lots of different chemical components. Some of these components are pollutants that are harmful to human health. Air pollutants come from a variety of different sources, including power plants, factories, agriculture, and transportation. Transportation vehicles are powered by combustion of fossil fuels, such as gasoline or diesel, to move from one place to another, and combustion of these fuels results in the release of gases and very small particles. These substances are known as “pollution emissions.” Different types of transportation can emit different amounts of air pollutants, which have an impact on local and regional air quality. Both trucks and trains are used to transport freight in the United States. Understanding how freight trucks and trains impact air quality is useful to learn ways to reduce pollution that is harmful to human health.
What is Air Quality and Why Does it Matter?
Air pollution is the presence of particulates (very small pieces of solid matter) and gases in the air, which are harmful for humans and the environment. Air pollution can lead to health problems such as asthma, lung disease, and sometimes death [1]. Young children and the elderly are more susceptible to health effects from air pollution. Research scientists study air quality, or the amount of pollution in the air, and connections between sources of air pollution and the effect of pollution on human health.
Man-made pollution in the atmosphere can be caused by gases and particles released from combustion sources. Combustion is the process by which a substance that contains energy is burned to release that energy. Some substances commonly used in combustion processes include fossil fuels like gasoline, diesel, coal, and natural gas. Energy obtained from burning fossil fuels provides electricity for our homes and also powers our vehicles. When a fuel is combusted, some chemicals are released as byproducts. These byproducts are called “emissions.” Emissions released from combustion sources contribute to “ambient air pollution” or the concentrations of various gases and particulates in the air that we breath.
Since Earth’s atmosphere is made of mostly nitrogen and oxygen, most emissions are in the form of compounds made up of nitrogen and oxygen molecules, called nitrogen oxides (or NOX). Because most of the energy sources that we burn are made of carbon, other byproducts are emitted as carbon compounds, including elemental carbon (EC), also known as soot. Emissions like NOX can react with other gases already in the atmosphere, like carbon-based gaseous substances called volatile organic compounds (or VOCs), which are emitted naturally from trees and also from human-created materials like paint and varnish. The combination of NOX and VOCs creates surface level ozone (or O3), also called “tropospheric ozone,” because the troposphere is the layer of the atmosphere at the Earth’s surface. Breathing in O3 at the Earth’s surface can damage lung tissue and cause health problems.1 While gases like NOX and VOCs are invisible to our eyes, EC is in the black smoke we see coming out of big trucks and buses, and also from your campfire. EC is a particulate. Very small particulates are harmful to human health because they can be breathed deep into the lungs and get into the blood stream. Harmful fine particulate matter is smaller than 2.5 μm in diameter and is called “PM2.5.,” where PM stands for particulate matter. EC is an example of a PM2.5 that comes directly from combustion, but PM2.5 can also form from reactions between gases in the atmosphere. While particulates are both directly released by combustion and created in the atmosphere, O3 is
In the United States, the Environmental Protection Agency (EPA) regulates air quality through a law called “The Clean Air Act.” Part of this law includes using scientific analysis to determine what concentrations of air pollutants are safe for human health. These standards are called the “National Ambient Air Quality Standards.” There are different standards for the six pollutants that are considered to be most harmful—O3, NO2, PM2.5, sulfur dioxide, carbon monoxide, and lead. Since the Clean Air Act began regulating air quality in 1970, concentrations of these six pollutants have decreased; however, concentrations of O3 and PM2.5 still remain unhealthy and problematic for some cities, especially southern California and the eastern US places that have higher levels of air pollution than are considered safe by the EPA are required to develop plans to reduce their air pollution.
To help determine what activities will help reduce air pollution in an area, scientists can conduct air quality experiments using powerful computers and computer modeling. These models simulate pollution emitted by cars, trucks, trains, and other sources and also simulate the chemical processes in the atmosphere that cause pollutants like O3 to form. These models include complex equations related to the atmosphere, as well as pollution transport by wind, production and destruction by chemical reactions, and removal from the atmosphere through precipitation. These computer models require lot of data inputs, including weather information (also known as “meteorology”) and information about emissions from all human and natural sources.
How Can Transportation Affect Air Pollution?
One major source of pollution-causing emissions is transportation [2]. Transportation includes cars, trucks, motorcycles, trains, airplanes, and ships. There are two main types of transportation; one is transporting people, known as “passenger transport,” and the other is transporting commodities like food, clothing, building materials, electronics, equipment, and many other items, known as “freight transport.” In the United States, trucks, trains, ships, and some airplanes are used to transport freight to factories that build things and to stores where we shop. Trucks and trains are powered by engines that require energy to operate, and these engines produce emissions from burning fuel. Emissions from transportation can be quantified, or calculated, from information like the number of trucks and trains operating on roads or railroad tracks, combined with information about how their engines operate and how much pollution they emit per mile traveled during warm or cold times of the year. This information can be used to estimate the total emissions from freight transport each year.
Because freight transportation can have a negative impact on air quality, “Is there a way to reduce emissions and improve the air we breathe by changing how we transport freight?” To answer this question, we created an experiment to analyze how moving more freight by railroad and less by truck could affect air quality in the Midwest United States. For this analysis, we first looked at changing commodity transport from truck to railroad just
It is important to know that not all freight can easily move by either truck or train. Typically, train transport can be slower, because individual train cars are combined along the transport route to make long trains (sometimes with 100–200 train cars) that can be transported more efficiently and at lower costs. Because of this, the routes are often not direct. On the other hand, trucks can travel directly from their origin to their destination with no stops, getting there faster. Therefore, fresh produce or seafood might spoil before it arrives at its destination, if transported by train. However, commodities, like car parts, furniture, or sand, do not spoil and can be moved by either truck or train. In addition, when a business is considering whether to transport its goods by truck or train, the owners are going to consider how much transportation will cost them. Generally, railroad transport is cheaper over longer distances, and truck transport is cheaper over shorter distances. For the experimental scenarios in this analysis, we only considered moving goods by train instead of truck if (1) it was possible for the type of commodity and (2) the commodity was being transported further than 400 miles. Figure 1A,B show the roads and railways where more railroad freight transport was added (in blue) and where truck freight transport was reduced (in red), for each scenario. In Scenario 1, 876 railcars replace 2,534 trucks per day; in Scenario 2, 37,854 railcars replace 103,450 trucks per day. Each of these emissions scenarios (Baseline, Scenario 1, and Scenario 2) was investigated using a computer model with meteorology data to determine the air pollution impacts of moving some freight transport off of trucks and onto trains. The only thing that is different between these scenarios is the emission, because the emission is a direct result of changing the number of trains and trucks used.
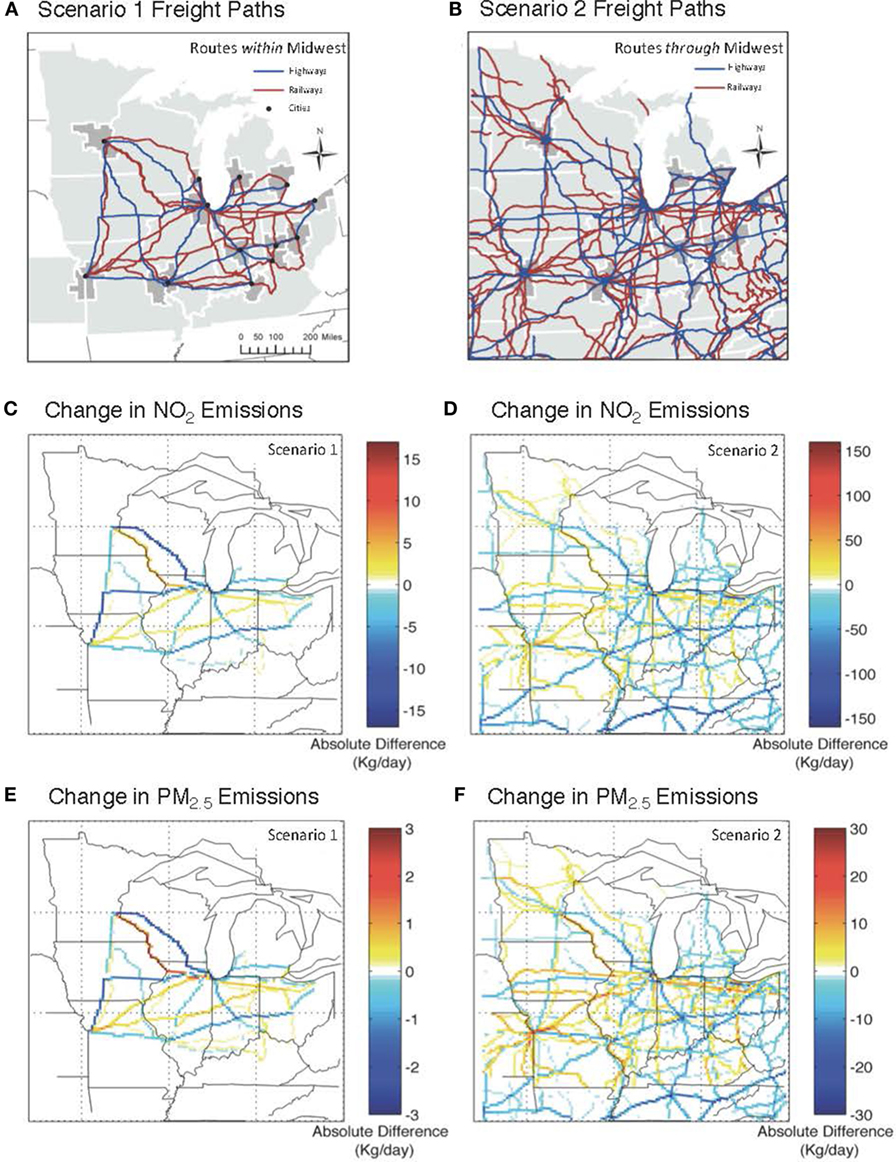
- Figure 1 - The top two panels show highway (blue lines) and railway (red lines) routes for A.
- Scenario 1 and B. Scenario 2, where changes in all emissions are only made along these paths. The bottom four panels show the daily average emissions changes in kilogram per day from the Baseline for Scenario 1 (left two panels) and Scenario 2 (right two panels) for the month of July. Although all pollutant emissions are modified for the scenarios, here we show the changes for just two pollutants: NO2 B,C and PM2.5 E,F. Note that each of the panels C–F is shown on different color scales. But in all panels, emissions reductions shown in blue tend to occur along highways, while emissions increases shown in yellow and red tend to occur along railways, with the darker blues and reds indicative of the greatest emissions changes. These changes occur because of the changes in fuel type associated with trains versus trucks. Emissions changes overall tend to be smaller for Scenario 1 (left two panels) and greater in Scenario 2 (right two panels). Figure adapted from Bickford et al. [3].
Our hypothesis for this experiment is that using more train transportation on railways and less truck transportation on highways means that emissions will increase along the red lines and decrease along the blue lines in Figure 1A,B and because freight trains can carry more goods per gallon of fuel used, air quality across the entire Midwest will improve. For the first part of our hypothesis, this is exactly the change in transportation emissions that we saw when we compared Scenario 1 and Scenario 2 to the Baseline Scenario (Figures 1C–F), where increases in emissions per day are colored red and decreases in blue. The changes in emissions for NO2 (Figures 1C) and primary PM2.5 (Figures 1E) in Scenario 1 show that, compared the Baseline Scenario, railway emissions generally increase and highway emissions generally decrease. This trend is repeated across the whole Midwest in Scenario 2 for NO2 (Figures 1D) and primary PM2.5 (Figures 1F) emissions.
Figure 2 shows the percent changes in concentrations of the pollutants NO2 and EC as a result of Scenario 2, in which freight is moving
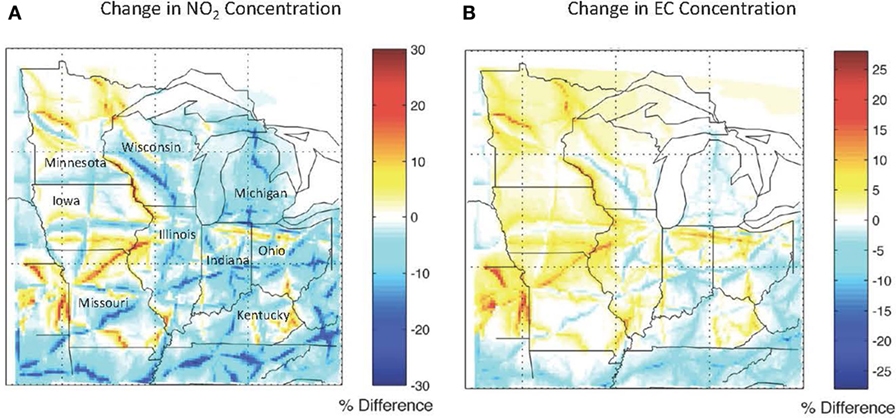
- Figure 2 - The percent difference in Scenario 2 from the baseline for the pollutants A.
- NO2 and B. EC. Increases in concentrations are in red, and decreases in concentrations are in blue, where darker blues and reds indicate the greatest changes. Generally, greatest increases in NO2 concentrations are found along railways, for instance along the Mississippi River at the border of Minnesota, Iowa, and Wisconsin, and greatest decreases in concentrations are found along highways, for instance those within the states of Missouri and Michigan. This occurs because in Scenario 2, emissions are removed from highways and added to railways. Reducing emissions from railways and increasing them on highways causes an increase in EC concentrations in B. as a result of the changes in transportation mode fuel type. Note the color scales are different; the maximum and minimum for A. are ⩲30 and −30%, respectively, and the same for B. are ⩲27.5 and −27.5%, respectively. Figure adapted from Bickford et al. [3].
Air Quality Studies Can Help Communities
This study shows how we can increase our understanding of how different human activities, like transportation, contribute to ambient air pollution. This helps both scientists examining air quality within a region, as well as air quality regulators at the US EPA who are in charge of monitoring air quality for public health purposes. For instance, by observing what kind of changes are introduced by modifying transportation emissions to reduce highway truck transport and increase train transport, we are able to estimate that emissions of NO2 and primary PM2.5 decrease near highways and increase near railways. Information regarding changes in ambient concentrations is valuable to communities who need to reduce their air pollution to protect public health, where even small changes locally can have an influence on whether a community succeeds or fails to achieve EPA’s air quality standards.
Conflict of Interest Statement
The authors declare that the research was conducted in the absence of any commercial or financial relationships that could be construed as a potential conflict of interest.
Glossary
Air pollution: ↑ Gaseous and particulate chemical compounds suspended in the atmosphere that can cause smog and affect human health.
Emissions: ↑ Compounds released as byproducts when energy sources are burned.
Nitrogen oxides (NOX): ↑ Gaseous chemical compounds consisting of nitrogen and oxygen, most commonly found in the atmosphere as nitrogen dioxide (NO2) or nitrogen monoxide (NO).
Elemental carbon (EC): ↑ Also known as black carbon, EC is dark soot emitted from incomplete combustion.
Volatile organic compounds (VOCs): ↑ Gaseous chemical compounds consisting of at least one carbon molecule.
Fine particulate matter (PM2.5): ↑ Liquid and solid compounds smaller than 2.5 μm in diameter that contain both carbon and non-carbon pollutants.
Ambient air quality: ↑ The measure of how polluted (poor air quality) or clean (good air quality) outdoor air is.
Commodities: ↑ Food and goods consumers purchase and use in their day-to-day lives, and materials used in manufacturing.
Freight: ↑ Commodities like food, clothing, building materials, electronics, equipment, and many other items that are transported by truck, train, or airplane.
Footnote
[1] ↑ You may have heard of something called “the ozone layer.” This is a layer of O3 in the stratosphere (the second layer in the earth’s atmosphere that sits above the troposphere) that protects people and plants on earth by absorbing harmful ultraviolet radiation from the sun, and is too high up for us to breath in. So “stratospheric ozone” is a good thing, while “tropospheric ozone” is a bad thing. When we talk about “ozone pollution” we’re only talking about tropospheric ozone.
Original Source Article
↑ Bickford, E., Holloway, T., Karambelas, A., Johnston, M., Adams, T., Janssen, M., et al. (2014). Emissions and air quality impacts of truck-to-rail freight modal shifts in the Midwestern United States. Environ. Sci. Technol. 48, 446–54. doi:10.1021/es4016102
References
[1] ↑ Burnett, R. T., Pope, C. A., Ezzati, M., Olives, C., Lim, S. S., Mehta, S., et al. 2014. An integrated risk function for estimating the global burden of disease attributable to ambient fine particulate matter exposure. Environ. Health Perspec. 122, 397–403. doi:10.1289/ehp.1307049
[2] ↑ EPA. 2014. U. S. Air Emissions Sources: Nitrogen Oxides. US Environmental Protection Agency.
[3] ↑ Bickford, E., Holloway, T., Karambelas, A., Johnston, M., Adams, T., Janssen, M., et al. 2014. Emissions and air quality impacts of truck-to-rail freight modal shifts in the Midwestern United States. Environ. Sci. Technol. 48, 446–54. doi:10.1021/es4016102