
Abstract
We experience the world around us as “continuous,” which means everything around us seems uninterrupted and ongoing. But how does our brain achieve that? Here, we suggest that the brain samples our environment in separate snapshots. We demonstrate that brain waves work just like a flipbook, where the rapid stream of related pictures creates the illusion of a continuous movie. We present results from a recent experiment that shows how brain waves capture the world that we see. These brain waves occur approximately 10 times per second and are called “alpha oscillations.” Here, we provide an overview of how these brain waves were discovered, how they can be measured, what they mean, and how they help to create our perception of the world around us.
The Discovery of the Brain Waves in Humans
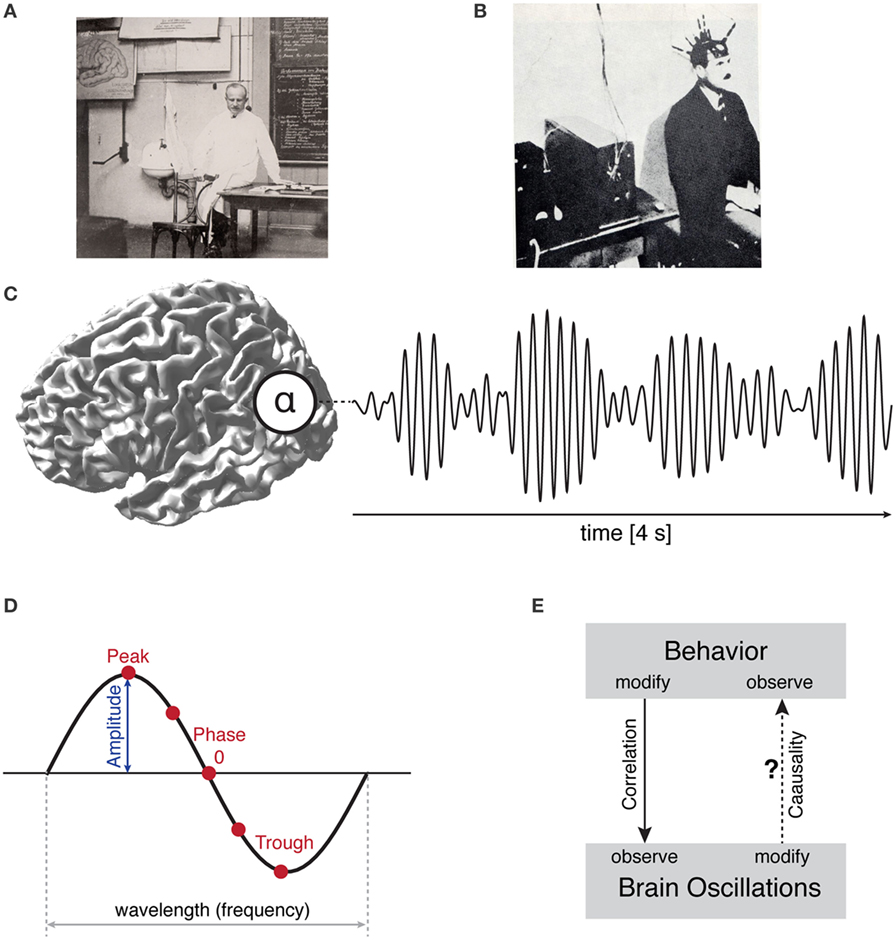
In 1924, a psychiatrist named Hans Berger (Figure 1A) set out to record the electrical activity of the human brain. He attached electrodes, which measured electrical activity, to his subject’s head, amplified the signals the electrodes measured so that they could be seen by scientific equipment, and observed curves that looked like waves (Figures 1B,C) [1]. This was the discovery of what we now call electroencephalogram (EEG), the electrical activity in the brain and brain waves, which are also called oscillations. He called the most prominent oscillation, which occurred approximately 10 times per second, the alpha oscillation (alpha is the first letter in the Greek alphabet). Alpha oscillations are easiest to measure in the visual system in the back of the brain. Berger first realized that brain waves change with mental effort when he tested his own son. Over the next decades, many more experiments demonstrated that specific brain waves are associated with using our senses to detect sense objects in the environment (seeing another person, hearing someone speak, etc.) and also with other brain functions, such as paying attention or storing important information in memory [2, 3]. However, Berger still did not know whether brain waves were just a byproduct that happens while the brain is at work, or whether brain waves are a key part of normal brain function.
- Figure 1
- A. Hans Berger of the University of Jena in Germany. B. An electroencephalogram being recorded in 1929. C. An illustration of where the alpha rhythm originates in the brain and what it looks like. D. The formal description of a wave and the key features of a wave. Here, we show one cycle of the 10 cycles per second seen in an alpha wave. Note that each cycle of a wave has a peak and trough and we can measure the amplitude (size) of each part of the alpha oscillation. E. So far, scientists have mainly changed perception and/or behavior in study participants and then observed the changes in brain oscillations (this type of observation, seeing how two things are related, is called correlation), but now we want to do the opposite: modify brain oscillations and observe how the participant’s behavior changes.
What is a Brain Wave?
Using math, brain waves can be described by their features. In Figure 1D, you can see the form of the brain waves. The frequency, or wavelength, shows how many times the wave repeats itself in a certain amount of time. The amplitude describes how “tall” the wave is, and the phase of the wave describes its position in the wave cycle at specific times (whether it is at the peak or the trough or somewhere in between). The waves are measured in microvolts (mV or 1/1,000,000 of a volt). A typical alpha wave is about 20–100 µV in size. The brain waves give scientists an idea of how excitable the millions of neurons are under each electrode. Previous experiments showed that certain types of brain waves are related to specific brain functions. For example, the act of seeing, called visual perception, is associated with a specific type of wave, called alpha wave.
How Can we Test the Function of a Brain Wave?
Scientists hypothesized that brain waves are not just a byproduct of the brain at work, but they might actually contribute in an important way to how the brain works [1]. If brain waves repeat themselves multiple times per second, does our perception and behavior also change multiple times per second [4]? This is what we wanted to find out!
In the past, most scientists observed a certain behavior in their participants, while they were simultaneously recording brain waves. Then they checked whether the behavior they saw and the brain waves they measured were somehow related to each other. We thought it would give us more information if we did this experiment in reverse, so that we could tell for sure if the brain waves were directly responsible for the behavior of the participants. We wondered if we could alter the brain waves and then study how perception and individual behavior change in relation to the change in brain waves (Figure 1E) [1]. In short, could we change brain waves to make the behavior change? We thought that one way to see if changing brain waves changes behavior would be to present some visual information to participants at the same frequency as the brain waves we wanted to study—in our case, the 10 Hz alpha waves. The ideas is that the brain will then tag along with the external rhythm, just as one would clap their hands along with the beat of a song. This way, we can train the brain to run at a certain rhythm. Then, we can investigate how the behavior changes when the alpha waves change.
Are Alpha Brain Waves and Visual Perception Related?
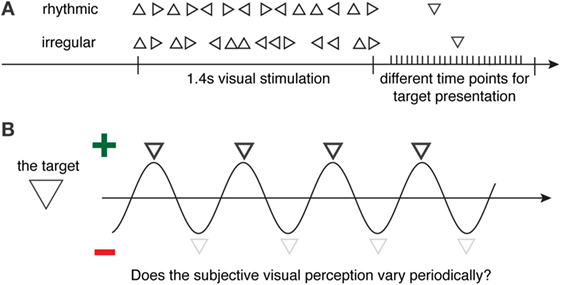
In our experiment, 20 healthy participants were recruited [5]. These participants were 18–29 years old. We showed participants a very fast movie on a computer screen. The movie included 14 triangles in different orientations (pointing up, right, or left) in the center of a black screen (Figure 2A).
- Figure 2
- A. The task: we showed subjects a flickering movie on a computer screen, with either a rhythmic (top row) or an irregular (bottom row) sequence of triangles for 1.4 s and then tested their ability to detect a downward facing triangle that was really difficult to see (on the right). We made it so difficult that they would only get three out four correct on average. And the participants did not know when the target would be presented. There were 25 possibilities (black ticks). B. Our idea was that, if the target was presented at different time points, perception would not be the same at every time point but it would change with alpha wave activity: you can see that the subjective visibility is higher at certain times points (dark gray triangle) than others (light gray triangles). This means that even though the presented triangle is physically the same on every trial, our perception of the triangle changes. And it changes because the alpha phase is either at peak or trough or in between. So little changes in the brain impact how we see the world.
These triangles were either flickered in a steady rhythm or in an irregular rhythm. In the steady rhythm, each triangle was present on the screen for 17 ms (ms, 1/1,000 of a second), with 83 ms in between each triangle. The reason we chose this timing for the rhythm is that 17 + 83 ms = 100 ms = 0.1 s = 10 repetitions in 1 s—the same as the rhythm of the 10 Hz alpha waves we were interested in studying! The irregular rhythm did not follow this timing. The movies with the steady rhythm and those with the irregular pattern were both 1.4 s long. All of the participants saw 400 movies—200 with rhythmic flicker patterns and 200 with irregular flicker patterns. The last 3 triangles in each trial were always in the same pattern (pointing left ⇒ up ⇒ right). This pattern told the participants that the target (a downward facing triangle) would appear next, and the participants had to push a button when they saw the target triangle. The downward facing triangle target was shown after a delay of between 34 and 850 ms, in 34 ms steps, after the flicker ended (meaning 34, 68, 102 ms, etc., up to 850 ms), so that we could measure the participants’ performance at 25 different time points. By keeping all experimental conditions same for all participants, we hypothesized that this experiment would tell us how detection of the target varied from moment to moment over 850 ms (Figure 2B).
Our Perception is Not Continuous But Varies Over Time
First, we analyzed how often the participants correctly pushed the button to indicate that they saw the target. The average performance for the rhythmic flickering condition was 75.10% correct, with an SD of 11.04%. The average performance for the irregular flickering condition was 74.38%, with SD of 12.37%. The SD tells us about how variable the observations were between participants. As you can see, the performance values that we saw for the two conditions were very similar and did not really differ between the two conditions. In other words, the ability of the participants to detect the target was the same no matter whether the sequence was presented in a rhythmic or irregular fashion.
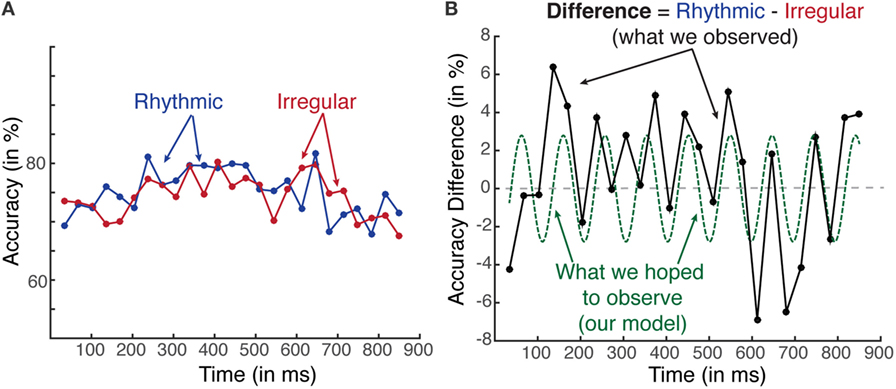
Next, we looked at the data for target detection performance over time, for all 25 different time delays between the movie and the target (Figure 3A). As you can see, when we look at the data this way, the accuracy of detecting the target is not exactly the same between both conditions and also varies from moment to moment. In order to highlight the difference between the rhythmic and irregular conditions, we subtracted the irregular from the rhythmic condition to remove all common effects (Figure 3B). Now you can see that this difference waxes and wanes over time. Since we look at the difference between two conditions, we will see positive and negative values. And this difference looks like the wave of the alpha oscillation, which is shown as the green dotted line in Figure 3B! This means that the difference between a rhythmic and an irregular process looks just like the brain process under investigation. Interesting!
- Figure 3
- A. If you compare the accuracy over time, you see that every time point has different values. B. Then we analyzed the difference (blue in A. minus dark red in A.) between the rhythmic and irregular conditions (black line), which waxes and wanes around zero. This difference can easily be described by a sine wave—at an alpha frequency. Interestingly, now we can see how a brain process affects behavior.
What We Learned about the Brain
Here, we tested how a type of brain waves called alpha oscillations is related to human visual perception. We show that visual perception is not the same from time point to time point, even though we perceive the world without any gaps. More interesting, the variations in visual perception look like a brain wave. This tells us that a brain process changes our perception of the world every few 100 ms—and we are completely unaware of this effect! But we can show that it exists by doing experiments. We call this type of perception as “discrete,” when just like in a flipbook, our brain takes snapshots, which are fused into a flowing movie.
But, if our brain actually sees things in a way that is discrete, why is it that we see things constantly, without little breaks in-between the snapshots? This is the power of the human brain to bring everything together, but we actually do not know the exact mechanisms yet. However, working in discrete steps is more energy efficient for the brain. Just like when you have to carry a heavy weight. It is difficult to carry it all the way. But it is easier to carry it a few steps, then take a break and take another few steps. The brain uses the same mechanism—in vision, touch, or hearing. But it is really fast, so we do not even notice it!
The Brain and Rhythms
The brain is obsessed with rhythms—that also explains why most people, adults, and kids all over the world love music, which has a strong rhythm to it. Music also drives our motor (movement) system: that is why most people love to dance or play an instrument in an orchestra. But our brains are also really good with rhythms that are not quite so rhythmic: for example, speech has a rhythm that changes a little bit depending on what you want to say. And different languages have different rhythms and feels to them. But the rhythm of speech helps the brain to predict what is most likely going to happen next, so that the brain can direct its resources to understand what is going on. Future studies will have to investigate how the brain integrates these discrete sensory snapshots so that we can perceive the world as continuous and not as a flipbook!
Glossary
Oscillation: ↑ Another word for a repeating process. We use it to describe rhythms that look similar to sine waves.
Discrete: ↑ Describes that a process consists of separate events.
Continuous: ↑ Describes that a process is uninterrupted. It is the opposite of discrete.
Conflict of Interest Statement
The authors declare that the research was conducted in the absence of any commercial or financial relationships that could be construed as a potential conflict of interest.
Acknowledgements
This work was supported by the Alexander von Humboldt Foundation (Feodor Lynen Program, RFH).
Original Source Article
↑ Helfrich, R. F., Huang, M., Wilson, G., and Knight, R. T. 2017. Prefrontal cortex modulates posterior alpha oscillations during top-down guided visual perception. Proc. Natl. Acad. Sci. U.S.A. 114:9457–62. doi:10.1073/pnas.1705965114
References
[1] ↑ Herrmann, C. S., Strüber, D., Helfrich, R. F., and Engel, A. K. 2016. EEG oscillations: from correlation to causality. Int. J. Psychophysiol. 103:12–21. doi:10.1016/j.ijpsycho.2015.02.003
[2] ↑ Klimesch, W. 2012. α-band oscillations, attention, and controlled access to stored information. Trends Cogn. Sci. 16:606–17. doi:10.1016/j.tics.2012.10.007
[3] ↑ Johnson, E. L., and Helfrich, R. F. 2016. How brain cells make memories. Front. Young Minds 4:5. doi:10.3389/frym.2016.00005
[4] ↑ VanRullen, R. 2016. Perceptual cycles. Trends Cogn. Sci. doi:10.1016/j.tics.2016.07.006
[5] ↑ Helfrich, R. F., Huanga, M., Wilsona, G., and Knight, R. T. 2017. Prefrontal cortex modulates posterior alpha oscillations during top-down guided visual perception. Proc. Natl. Acad. Sci. U.S.A. 114(35):9457–62. doi:10.1073/pnas.1705965114